Reflections on Q3 Alpha
As the quarter comes to an end, I’d like to take a moment to reflect on some of the ways our analytics generated portable alpha in Q3 and how, based on those same analytics this morning, it might be found in Q4. I emphasize might because as an active manager I know better than to make bold predictions for the next three months.
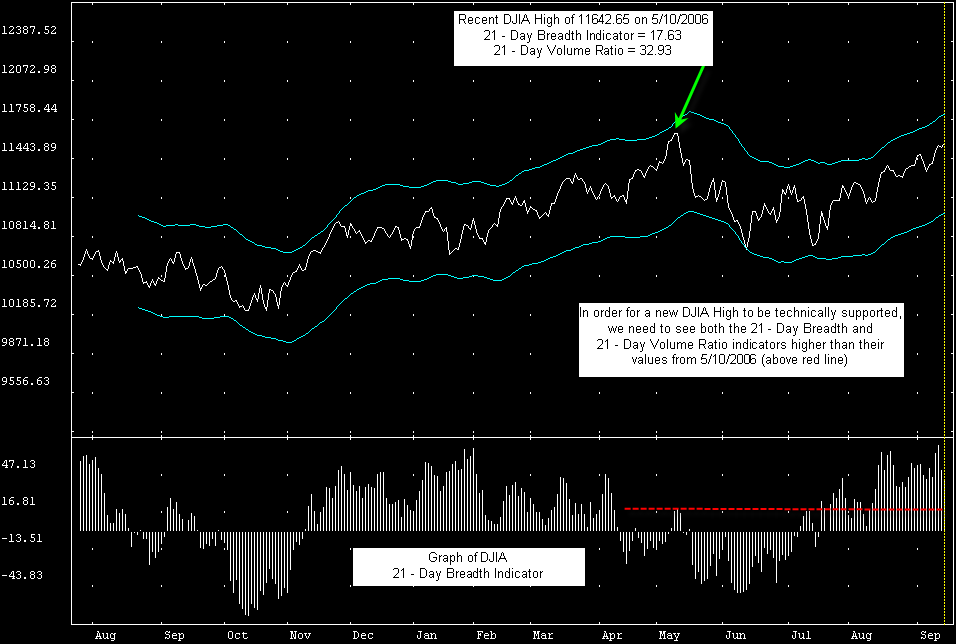
We spent the majority of Q3 in a defensive posture since our long-term macro model turned bearish on April 28th 2006 and didn’t turn bullish until August 23rd. This turned out to be an excellent switch as alpha was easily generated by the performance of several inverse index funds through May and June. FYI – we only use the long-term macro model within the AAS Model Fund Portfolios.
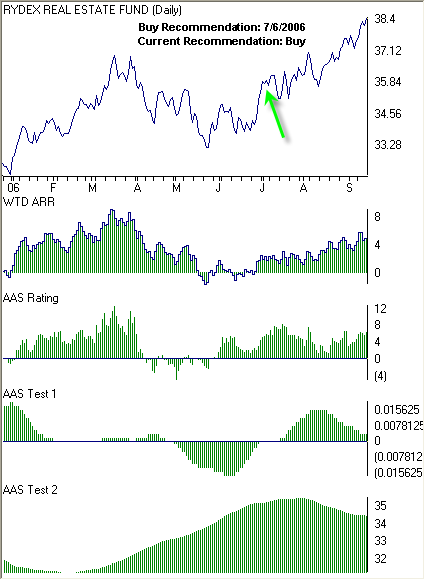
Looking back to our first newsletter of Q3, there were no “buy” recommended major market or style-box derivatives. In fact, there were only two “buy” recommended sectors – Real Estate and Utilities which provided, and in some cases continue to provide, significant alpha for investors. However, we were beginning to again see the alpha-generating potential of inverse funds, which remained among our top ten rated investments until mid-July.
By the end of July the analytics had three more “buy” recommended sectors: Energy, Healthcare and Telecommunications. We also had five “short-sale” recommended sectors with Transports being the weakest. The long-term macro model was still bearish and we still recommended between a 0% and 25% equity allocation into the alpha-generating portion of the overall investment portfolio. The analytics had yet to provide “buy” recommendations for any of the major-market or style-box derivatives.
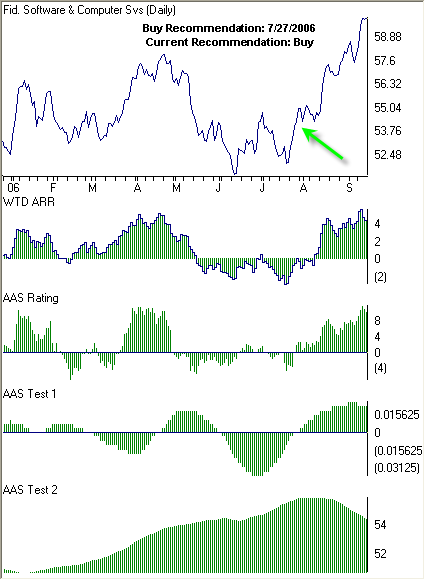
Towards mid-August the markets really started to take off. At this point, the analytics had four “buy” recommended major market derivatives including NYSE 100, the S&P 100, the Dow Jones Industrials Diamond Trust and the S&P 500. Large Cap Value was the one “buy” recommended style-box derivative, while Utilities, Software, Telecommunication, Healthcare and Non-Cyclical were the five “buy” recommended sector derivatives.
Our long-term macro model was still bearish, but improving rapidly. One of the hardest aspects of being a quant investor and market technician is not overriding the signals when it becomes clear that they will eventually make a shift. The markets were drinking jet fuel, buying opportunities were popping up left and right, yet the model was still a week or so behind and as such the model fund portfolios were still invested in cash or inverse funds. It can be frustrating, but sticking with the discipline, in my opinion, is a crucial component of successful investing.
By late-August, the macro model had turned bullish and we were recommending between 50% and 75% equity allocation within the alpha-generating component of the portfolio. The large cap major market and style-box derivatives were clearly dominant and there were eight “buy” recommended sectors. By this point, Natural Resources were a “short-sell” recommended sector, with Energy soon to follow. The AAS Model Fund portfolios were 100% invested and the Model Stock Portfolio was nearly 60% invested.
The September 11th newsletter produced six “buy” recommended major market derivatives, two “buy” recommended style-box derivatives and nine “buy” recommended sector derivatives. Real Estate and Technology dominated the top ten fund investments while the top ten stocks ranged from Financial Services and Computers to Retail to Aerospace. The rally was broad-based and things were looking up.
So here we are at the end of a very good quarter trying to figure out what to look for over the next three months to generate alpha. I’m not going to predict where the alpha will be, simply because I can’t do that. But I can share my sentiment and some of today’s analysis.
There are two components of investing in portable alpha – adequate, cheap market exposure (beta) and non-correlated investments outperforming the benchmark (alpha). Based on today’s analysis, we recommend beta from the NASDAQ 100 (QQQQ), the Fidelity NASDAQ Composite Index (ONEQ) and/or the S&P 100 (OEF). Narrowing that down further is a recommendation for the Large Cap Core (JKD) derivative. Alpha can continue to be found in Software (IGV) and Financial Services (IYG). This is just an observation, but Energy (IYE) has shifted up from a “sell” recommendation to a “neutral” recommendation. That doesn’t mean anything yet, but it’s something I’m going to watch over the next few days.
In terms of my sentiment, I’m still bullish. However, I’m not going to be surprised to see a pull-back next week as profit-taking ensues. The first few earnings releases will be very important in terms of dictating how the market moves over the next quarter. If we see solid earnings, I don’t see any reason why the markets won’t continue the trend. If, however, the slowing economy is beginning to make a bigger than expected impact on margins, things might go downhill very quickly. Have a great weekend!
Top Rated Major Market Derivative – NASDAQ 100 (QQQQ)
Top Rated Style-Box Derivative – Morningstar Large Cap Core (JKD)
Top Rated Sector Derivative – iShares Dow Jones Software (IGV)
Today’s Top “Buy” Recommended Stocks
We spent the majority of Q3 in a defensive posture since our long-term macro model turned bearish on April 28th 2006 and didn’t turn bullish until August 23rd. This turned out to be an excellent switch as alpha was easily generated by the performance of several inverse index funds through May and June. FYI – we only use the long-term macro model within the AAS Model Fund Portfolios.
Looking back to our first newsletter of Q3, there were no “buy” recommended major market or style-box derivatives. In fact, there were only two “buy” recommended sectors – Real Estate and Utilities which provided, and in some cases continue to provide, significant alpha for investors. However, we were beginning to again see the alpha-generating potential of inverse funds, which remained among our top ten rated investments until mid-July.
By the end of July the analytics had three more “buy” recommended sectors: Energy, Healthcare and Telecommunications. We also had five “short-sale” recommended sectors with Transports being the weakest. The long-term macro model was still bearish and we still recommended between a 0% and 25% equity allocation into the alpha-generating portion of the overall investment portfolio. The analytics had yet to provide “buy” recommendations for any of the major-market or style-box derivatives.
Towards mid-August the markets really started to take off. At this point, the analytics had four “buy” recommended major market derivatives including NYSE 100, the S&P 100, the Dow Jones Industrials Diamond Trust and the S&P 500. Large Cap Value was the one “buy” recommended style-box derivative, while Utilities, Software, Telecommunication, Healthcare and Non-Cyclical were the five “buy” recommended sector derivatives.
Our long-term macro model was still bearish, but improving rapidly. One of the hardest aspects of being a quant investor and market technician is not overriding the signals when it becomes clear that they will eventually make a shift. The markets were drinking jet fuel, buying opportunities were popping up left and right, yet the model was still a week or so behind and as such the model fund portfolios were still invested in cash or inverse funds. It can be frustrating, but sticking with the discipline, in my opinion, is a crucial component of successful investing.
By late-August, the macro model had turned bullish and we were recommending between 50% and 75% equity allocation within the alpha-generating component of the portfolio. The large cap major market and style-box derivatives were clearly dominant and there were eight “buy” recommended sectors. By this point, Natural Resources were a “short-sell” recommended sector, with Energy soon to follow. The AAS Model Fund portfolios were 100% invested and the Model Stock Portfolio was nearly 60% invested.
The September 11th newsletter produced six “buy” recommended major market derivatives, two “buy” recommended style-box derivatives and nine “buy” recommended sector derivatives. Real Estate and Technology dominated the top ten fund investments while the top ten stocks ranged from Financial Services and Computers to Retail to Aerospace. The rally was broad-based and things were looking up.
So here we are at the end of a very good quarter trying to figure out what to look for over the next three months to generate alpha. I’m not going to predict where the alpha will be, simply because I can’t do that. But I can share my sentiment and some of today’s analysis.
There are two components of investing in portable alpha – adequate, cheap market exposure (beta) and non-correlated investments outperforming the benchmark (alpha). Based on today’s analysis, we recommend beta from the NASDAQ 100 (QQQQ), the Fidelity NASDAQ Composite Index (ONEQ) and/or the S&P 100 (OEF). Narrowing that down further is a recommendation for the Large Cap Core (JKD) derivative. Alpha can continue to be found in Software (IGV) and Financial Services (IYG). This is just an observation, but Energy (IYE) has shifted up from a “sell” recommendation to a “neutral” recommendation. That doesn’t mean anything yet, but it’s something I’m going to watch over the next few days.
In terms of my sentiment, I’m still bullish. However, I’m not going to be surprised to see a pull-back next week as profit-taking ensues. The first few earnings releases will be very important in terms of dictating how the market moves over the next quarter. If we see solid earnings, I don’t see any reason why the markets won’t continue the trend. If, however, the slowing economy is beginning to make a bigger than expected impact on margins, things might go downhill very quickly. Have a great weekend!
Beta Exposure and Portable Alpha Generation
Top Rated Major Market Derivative – NASDAQ 100 (QQQQ)
Top Rated Style-Box Derivative – Morningstar Large Cap Core (JKD)
Top Rated Sector Derivative – iShares Dow Jones Software (IGV)
Today’s Top “Buy” Recommended Stocks
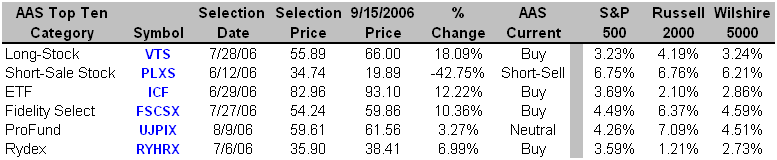
- CPI Corp. (CPY)
- Gymboree Corp. (GYMB)
- OM Group Inc. (OMG)
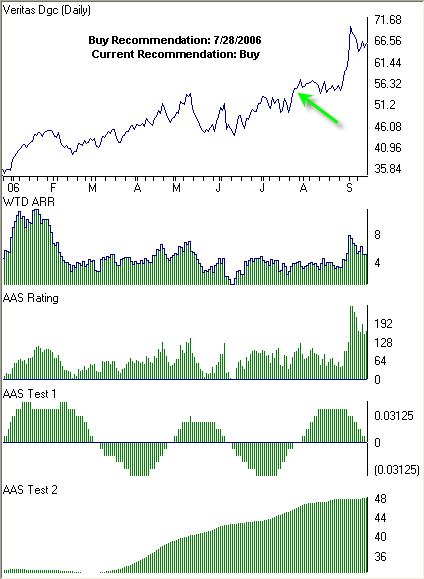
- Veritas DGC Inc. (VTS)
- American Eagle Outfitters Inc. (AEOS)
posted by Justin at
11:03 AM
|
0 comments
![]()
![]()