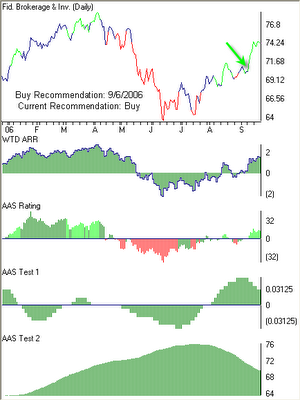
AAS Top Ten as of September 15, 2006
We’ve color-coded the graphs to represent one of the three “recommendations” our analytic produces for each security. A red line coincides with a “sell” recommendation. A blue line represents a “neutral” or “hold” recommendation and the green line equates to a “buy” recommendation.
The green arrow represents the first date that the security became an “AAS Recommended Buy” after previously being an “AAS Recommended Sell.” For the “Short-Sale” group, the red arrow represents the first date that the security became an “AAS Recommended Sell” after previously being “buy” recommended. Also included are the most recent recommendations of each security.


0 Comments:
Post a Comment
<< Home