AAS Top Ten as of September 8, 2006
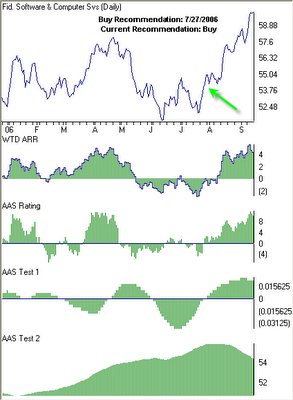
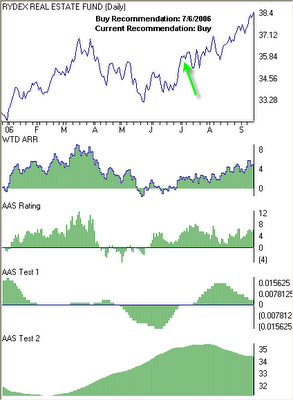
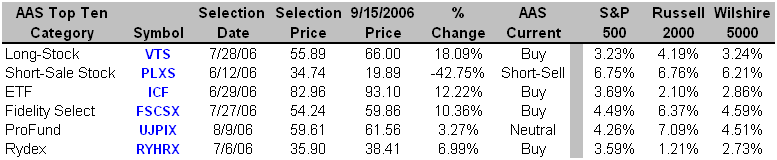
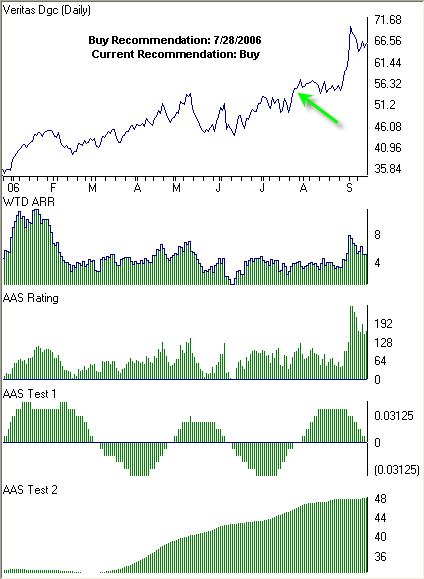
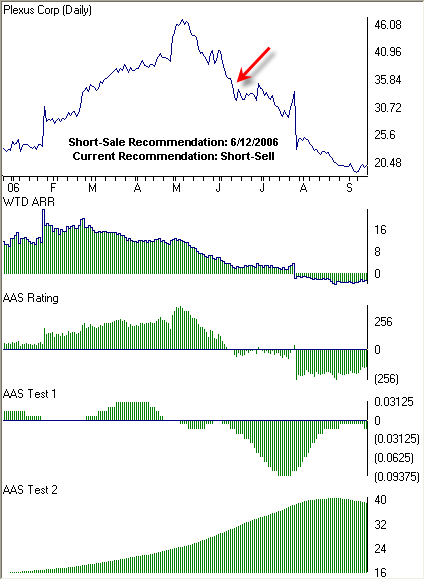
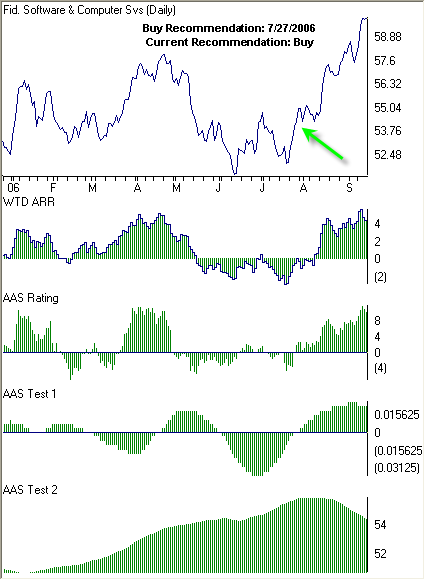
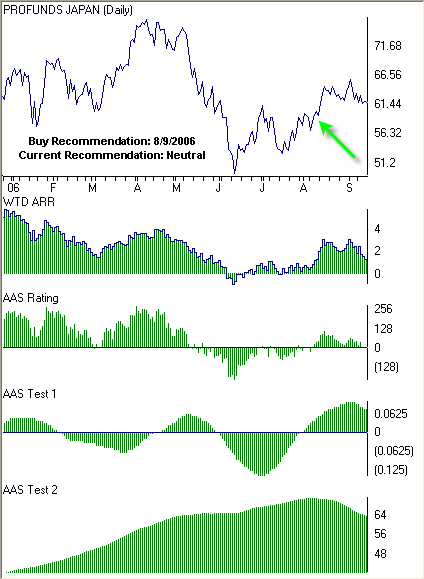
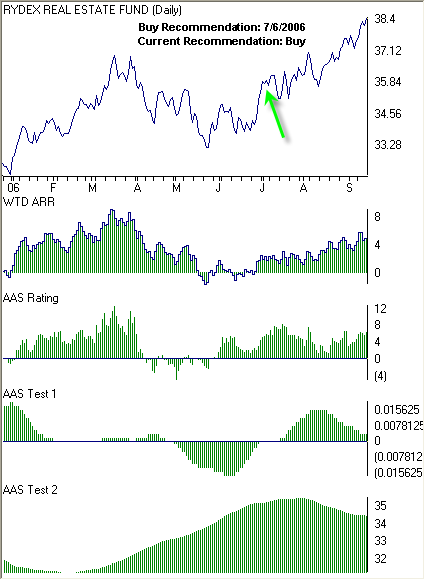
The graphs below represent our top rated investments within six different categories as of Friday, September 8, 2006. The analytics we use to rate and select investments are based on a time-weighted alpha rating score that seeks to highlight investments beginning a bullish trend. You can tell from the chart and graphs below that the analytic was correct in each of the six categories of investments with an average gain of 15.61% since the initial “buy” or “short-sale” recommendation.
The green arrow represents the first date that the security became an “AAS Recommended Buy” after previously being an “AAS Recommended Sell.” For the “Short-Sale” group, the red arrow represents the first date that the security became an “AAS Recommended Sell” after previously being “buy” recommended. Also included are the most recent recommendations of each security.


The green arrow represents the first date that the security became an “AAS Recommended Buy” after previously being an “AAS Recommended Sell.” For the “Short-Sale” group, the red arrow represents the first date that the security became an “AAS Recommended Sell” after previously being “buy” recommended. Also included are the most recent recommendations of each security.
(Click on the picture for a bigger preview)

posted by Justin at
3:47 PM
![]()
![]()


0 Comments:
Post a Comment
<< Home