Portable Alpha Daily

Google
 
Web alpha-advisor.com

Thursday, March 29, 2007

Good Morning

Short-Term Technical Indicators

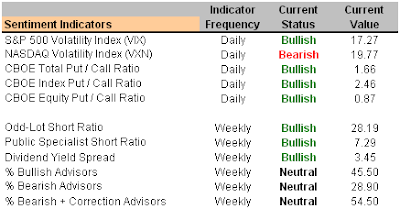
Investor Sentiment

Long-Term Market Model – Bearish since December 8th.

Asset Allocation – AAS Model Portfolios are allocated at 50% cash and 50% long.

Top Alpha Generating Securities
Date = Date of AAS “Buy” or “Short/Sell” Recommendation

Top Major Market ETF – iShares S&P Mid Cap 400 (IJH 3/20/07)

Top Style-Box ETF for Alpha – iShares Morningstar Small Cap Growth (JKK 3/20/07)

Top Sector ETF for Alpha – iShares Dow Jones U.S. Utilities (IDU 3/12/07)

Top Long Stocks for Alpha

Precision Castparts Corp. (PCP 9/20/06)

Martin Marietta Materials Inc. (MLM 11/6/06)

RTI International Metals (RTI 10/11/06)

U.S. Steel Co. (X 2/28/07)

Brush Engineered Material (BW 3/6/07)

Allegheny Technology Inc. (ATI 10/5/06)

Blue Coat Systems Inc. (BCSI 3/1/07)

MEMC Electronic Materials Inc. (WFR 1/8/07)

Chaparral Steel Co. (CHAP 11/1/06)

Lone Star Technologies, Inc. (LSS 3/29/07)

Top Short Stocks for Alpha

Beazer Homes USA Inc. (BZH 1/25/07)

Meritage Homes Corp. (MTH 12/18/06)

The Ryland Group, Inc. (RYL 2/20/07)

Advanced Micro Devices Inc. (AMD 9/27/06)

Fremont General Corp. (FMT 12/29/06)

Tuesday, March 27, 2007

Good Morning

We’re beginning to roll out our spring 2007 marketing initiatives for Alpha Advisor Service, LLC so I want to take this opportunity to offer free trials to any loyal readers of the Portable Alpha Daily blog. If interested, you can send us an email (info@alpha-advisor.com) with only your first and last name – we’ll take care of the rest.

As you might know, AAS is a subscription-based service that is designed to help investors isolate alpha-generating equities, funds and ETF’s. Our selection process is a combination of fundamental screening done annually and quantitative analysis structured around proprietary algorithms. We include Buy, Neutral, and Sell recommendations on over 1800 securities, as well as Sell Limit values and five model portfolios. Take a look at the recent archived newsletter located in the right margin (or other archives) for examples of what we provide twice-weekly.

What we offer our subscribers is a disciplined approach to selecting and actively managing investments. This can be a powerful tool for the do-it-yourself investor searching for investment ideas or for the professional (manager, planner, etc) wanting to spend more time building relationships than managing portfolios.

We’ve experienced tremendous growth over the past few months and expect the trend to continue. As a loyal reader of this blog, you’ve come to appreciate the selections listed below. If you’d like to utilize our analysis on a much bigger scale, or be provided with our Buy and Sell recommendations as they occur, take out a 30-day trial free of charge (we won’t even ask for credit card info until you decide to subscribe). Please feel free to email us with any questions.

Short-Term Technical Indicators

Investor Sentiment

Long-Term Market Model – Bearish since December 8th.

Asset Allocation – AAS Model Portfolios are allocated at 50% cash and 50% long.

Top Alpha Generating Securities
Date = Date of AAS “Buy” or “Short/Sell” Recommendation

Top Major Market ETF – iShares S&P Mid Cap 400 (IJH 3/20/07)

Top Style-Box ETF for Alpha – iShares Morningstar Mid Cap Growth (JKH 3/20/07)

Top Sector ETF for Alpha – iShares Dow Jones U.S. Utilities (IDU 3/12/07)

Top Long Stocks for Alpha

RTI International Metals (RTI 10/11/06)

Precision Castparts Corp. (PCP 9/20/06)

Martin Marietta Materials Inc. (MLM 11/6/06)

MEMC Electronic Materials Inc. (WFR 1/8/07)

Brush Engineered Material (BW 3/6/07)

Allegheny Technology Inc. (ATI 10/5/06)

U.S. Steel Co. (X 2/28/07)

Blue Coat Systems Inc. (BCSI 3/1/07)

Kronos Inc. (KRON 2/27/07)

Deckers Outdoor Corp. (DECK 9/7/06)

Top Short Stocks for Alpha

Beazer Homes USA Inc. (BZH 1/25/07)

Meritage Homes Corp. (MTH 12/18/06)

Advanced Micro Devices Inc. (AMD 9/27/06)

Fremont General Corp. (FMT 12/29/06)

Spectrum Brands Inc. (SPC 2/8/07)

Sunday, March 25, 2007

Alpha in Energy, Utilities and Materials

Our long-term market model remains bearish as of December 8th. The total universe of stocks, ETF’s and mutual funds which we review on a daily basis is 1853. Of those reviewed, 598 are rated "Buy," 288 are rated "Sell" and 967 "Neutral.” These numbers along with the technical indicators which we follow have improved significantly over last week’s indicators when we reduced our model portfolio allocations. We have adjusted our recommendations accordingly and are currently recommending an allocation in the range of 50% in cash or money market investments and 50% Long Funds or ETF’s. The allocation recommendation for the model stock portfolio was also adjusted to approximately 50% long with 50% cash.

Market conditions in the coming will in part be determined by two reports on consumer sentiment, which may serve to further quantify the magnitude of the recent turmoil in the sub-prime lending market and its impact on the economy. Additional reports scheduled to be released in the coming wee include: new-home sales, Durable Goods Orders and GDP Q4, Personal Income and Spending, the Chicago PMI and University of Michigan Sentiment Index, which may well add fuel to the recent market rally.

Leadership in the recent rally is coming from the Mid and Small cap members of the Utility, Energy / Natural Resources, Basic Materials and Industrial sectors. This can be seen in a quick review of the Market Overview page.

Those seeking Mid Cap opportunities should examine the iShares S&P Mid Cap 400 (IJH), iShares tracking the Morningstar Mid Cap Growth (JKH) or Value (JKI) indexes or for a blended approach the iShares Morningstar Mid Cap Core (JKG). Similarly, small cap enthusiasts will be drawn to the iShares Morningstar Small Growth (JKK), iShares Morningstar Small Core (JKJ) or iShares Morningstar Small Value (JKL).

Within the Fidelity group, the Fidelity Leveraged Company Stock (FLVCX), Fidelity Aggressive Growth (FDEGX) or Fidelity Value (FDVLX) provide similar Mid and Small cap exposure. Likewise, investors looking for opportunities from ProFunds should start with the ProFund Mid Cap Value (MLPIX) or the ProFund Small Cap Value (SVPIX) funds. Alternatives from Rydex include the Rydex Mid Cap Value (RYAVX), Rydex Mid Cap Growth (RYBHX), Rydex Mid Cap Advantage (RYMDX) or even the Rydex Russell 2000 Advantage (RYMKX) funds.

Subscribers seeking to employ ETF’s to match up with the Sectors mentioned above might examine the Oil Service HOLDRs (OIH), Utilities HOLDRs (UTH), Vanguard Utilities (VPU), iShares DJ U.S. Utilities (IDU) or Vanguard Materials (VAW). The top AAS rated mutual funds which match up nicely are Fidelity Select Utilities Growth (FSUTX), Fidelity Select Energy Service (FSESX), ProFund Ultra Sector Basic Materials (BMPIX), ProFund Ultra Sector Utilities (UTPIX) or Rydex Energy Services (RYVIX).

Individual equities to look at which are highly rated and work into these Sectors are RMI Titanium Co. (RTI), Precision Castparts Corp. (PCP), Allegheny Technologies (ATI), MEMC Electric Material (WFR), Martin Marietta Materials (MLM), Brush Wellman Inc. (BW), U.S. Steel Corp. (X), Constellation Energy Group (CEG), Vulcan Materials Co. (VMC) and Cummins Inc. (CMI).

Monday Morning Links

Sunday links from Abnormal Returns.

Excellent article from All About Alpha on the importance on alpha centric investing.

Alpha generation by selling naked puts ahead of earnings.

Hedge fund blog on the consistency of irrationality in the industry.

Larry put’s forth his solutions to the sub-prime bonanza.

The mother lode of links from The Big Picture.

Dr. Brett shares his steps toward successful stock picking.

Barclays Global launches a private equity ETF.

Short-Term Technical Indicators

Investor Sentiment

Long-Term Market Model – Bearish since December 8th.

Asset Allocation – AAS Model Portfolios are allocated at 50% cash and 50% long.

Top Alpha Generating Securities
Date = Date of AAS “Buy” or “Short/Sell” Recommendation

Top Major Market ETF – iShares S&P Mid Cap 400 (IJH 3/20/07)

Top Style-Box ETF for Alpha – iShares Morningstar Mid Cap Growth (JKH 3/20/07)

Top Sector ETF for Alpha – iShares Dow Jones U.S. Utilities (IDU 3/12/07)

Top Long Stocks for Alpha

RTI International Metals (RTI 10/11/06)

Precision Castparts Corp. (PCP 9/20/06)

Allegheny Technology Inc. (ATI 10/5/06)

MEMC Electronic Materials Inc. (WFR 1/8/07)

Martin Marietta Materials Inc. (MLM 11/6/06)

Brush Engineered Material (BW 3/6/07)

Deckers Outdoor Corp. (DECK 9/7/06)

Blue Coat Systems Inc. (BCSI 3/1/07)

U.S. Steel Co. (X 2/28/07)

Constellation Energy Group Inc. (CEG 11/24/06)

Top Short Stocks for Alpha

Beazer Homes USA Inc. (BZH 1/25/07)

Spectrum Brands Inc. (SPC 2/8/07)

Meritage Homes Corp. (MTH 12/18/06)

Advanced Micro Devices Inc. (AMD 9/27/06)

Shuffle Master Inc. (SHFL 12/11/06)

Labels:

Saturday, March 24, 2007

AAS Top Six on March 16, 2007

The graphs below represent our top rated investments within six different categories as of Friday, March 16, 2007. The analytics we use to rate and select investments are based on a time-weighted alpha rating score that seeks to highlight investments beginning a bullish trend and generating alpha. Four of the six investments have positive returns with an average gain of 15.76% since the initial “buy” or “short/sell” recommendation.

I’ve color-coded the graphs to represent one of the three “recommendations” our analytic produces for each security. A red line coincides with a “Short/Sell” recommendation. A blue line represents a “Neutral” or “Hold” recommendation and the green line equates to a “Buy” recommendation.

The green arrow represents the first date that the security became an “AAS Recommended Buy” after previously being an “AAS Recommended Sell.” For the “Short/Sell” group, the red arrow represents the first date that the security became an “AAS Recommended Sell” after previously being “buy” recommended. Also included are the most recent recommendations of each security.

(Click on Chart/Graphs to enlarge)

Labels:

Tuesday, March 20, 2007

Mid Cap Markets Providing Alpha

Short-Term Technical Indicators

Investor Sentiment

Long-Term Market Model – Bearish since December 8th.

Asset Allocation – AAS Model Portfolios have 75% cash allocations and mixed long – short allocations.

Top Alpha Generating Securities
Date = Date of AAS “Buy” or “Short/Sell” Recommendation

Top Major Market ETF – iShares S&P Mid Cap 400 (IJH 3/20/07)

Top Style-Box ETF for Alpha – iShares Morningstar Mid Core (JKG 3/20/07)

Top Sector ETF for Alpha – iShares Dow Jones U.S. Utilities (IDU 3/12/07)

Top Long Stocks for Alpha

Precision Castparts Corp. (PCP 9/20/06)

Allegheny Technology Inc. (ATI 10/5/06)

RTI International Metals (RTI 10/11/06)

Deckers Outdoor Corp. (DECK 9/7/06)

Martin Marietta Materials Inc. (MLM 11/6/06)

Brush Engineered Material (BW 3/6/07)

Vulcan Materials Inc. (VMC 10/31/06)

WebEx Communications Inc. (WEBX 2/13/07)

Blue Coat Systems Inc. (BCSI 3/1/07)

U.S. Steel Co. (X 2/28/07)

Top Short Stocks for Alpha

Beazer Homes USA Inc. (BZH 1/25/07)

Meritage Homes Corp. (MTH 12/18/06)

Spectrum Brands Inc. (SPC 2/8/07)

Google Inc. (GOOG 12/18/06)

Advanced Micro Devices Inc. (AMD 9/27/06)

Monday, March 19, 2007

Good Morning

Short-Term Technical Indicators

Investor Sentiment

Long-Term Market Model – Bearish since December 8th.

Asset Allocation – AAS Model Portfolios have 75% cash allocations and mixed long – short allocations.

Top Alpha Generating Securities
Date = Date of AAS “Buy” or “Short/Sell” Recommendation

Top Major Market ETF – No buy recommended major market investments

Top Style-Box ETF for Alpha – No buy recommended style-box investments

Top Sector ETF for Alpha – iShares Dow Jones U.S. Utilities (IDU 3/12/07)

Top Long Stocks for Alpha

Precision Castparts Corp. (PCP 9/20/06)

RTI International Metals (RTI 10/11/06)

Allegheny Technology Inc. (ATI 10/5/06)

Deckers Outdoor Corp. (DECK 9/7/06)

Blue Coat Systems Inc. (BCSI 3/1/07)

WebEx Communications Inc. (WEBX 2/13/07)

Belden CDT Inc. (BDC 1/19/07)

Brush Engineered Material (BW 3/6/07)

Chemed Corp. (CHE 3/8/07)

Constellation Energy Group Inc. (CEG 11/24/06)

Top Short Stocks for Alpha

Beazer Homes USA Inc. (BZH 1/25/07)

Meritage Homes Corp. (MTH 12/18/06)

Spectrum Brands Inc. (SPC 2/8/07)

Shuffle Master Inc. (SHFL 12/11/06)

The Ryland Group Inc. (RYL 2/20/07)

Sunday, March 18, 2007

Good Monday Morning

Monday Morning Links:

Dr. Brett on the bearish equity-put call ratio. (Our analysis has that ratio pegged as bullish, which illustrates the conundrum many technical investors are facing at the moment)

Abnormal Returns with links on the Blackstone IPO.

Alpha Male reports on hedge fund of funds.

Daily Options Report on March Expiration Madness.

The Curse of the Fat-Fingered Trader from FT Alphaville via Barry Ritholtz.

Great post from Hedge Fund blog on the 2 and 20 fee structure.

Millionaire Now! on the lag in mining stocks.

The U.S. markets slid last week on concerns of broad-market contagion linked to an increased level of mortgage defaults. Also, several economic reports illustrated that inflation remains a concern, which further reduces the likelihood of a Fed interest-rate cut in the near future.

Both the Financial and Retail sectors were down on speculation that rising foreclosures will slow home sales and restrain retail spending. Prices increased more than economists expected last month, as seen in the PPI and CPI repots.

The S&P 500 fell 15.90, or 1.1 percent, to 1386.95, wiping out the prior week's recovery and slipping to its level from the week ended March 2, when it dropped 4.4 percent. The Dow Jones Industrial Average sank 165.91, or 1.4 percent, to 12,110.41 while the NASDAQ Composite Index declined 14.89, or 0.6 percent, to 2372.66. Decliners outnumbered gainers on the NYSE by about five to three.

Our long-term market model remains bearish as of December 8th. The total universe of stocks, ETF’s and mutual funds which we review on a daily basis is 1859. Of those reviewed, 276 are rated "Buy," 743 are rated "Sell" and 840 "Neutral.” We reduced our model portfolio allocations this past week and are currently recommending an allocation of 75% in cash or money market investments and 25% mixed between long and inverse funds. The model stock portfolio remains roughly 27% long with 73% cash.

The traditional technical measurements of market health match up closely to those in place last year between mid-May and late-July. The only bullish technical indicators we observe are the Bullish % Indexes for the S&P 500, NASDAQ and NYSE. All the other technical indicators, with the exception of the NYSE TRIN, are Bearish as of Friday’s close.

However, we’re seeing mixed readings with regard to the sentiment indicators we employ in our analysis. The volatility experienced over the last two weeks has brought VIX up to levels that we define as Bullish. Overall, on a technical basis the market appears to be in line with what can be expected following a modest correction.

As in the prior two or three weeks, we continue to see opportunities for alpha within the Utilities (IDU), Telecom (IXP and IYZ), Broadband (BDH) and Basic Materials (IYM).

The Utility sector is our top rated, currently holding a “Buy” recommendation with an AAS Rating Score of 26.93. Those interested in Utilities for alpha might look at the following ETF and mutual funds: Utilities HOLDRS (UTH), iShares DJ US Utilities (IDU), Vanguard Utilities (VPU), Fidelity Select Utilities Growth (FSUTX), Utilities Spider (XLU), ProFund Ultra Sector Utilities (UTPIX), Rydex Utilities (RYUIX). On an equity basis, Entergy Corp (ETR), Questar Corp (STR), Constellation Energy Group (CEG) or Public Service Enterprise Group (PEG) are generating alpha.

Basic Materials alternatives include: Profund Ultra Sector Basic Materials (BMPIX), Rydex Basic Materials (RYBIX), iShares DJ US Basic Materials (IYM), Vanguard Materials (VAW) and Materials SPDR (XLB). Allegheny Technologies (ATI), Ryerson Inc. (RYI), Rock-Tenn Co. (RKT), Chaporral Steel (CHAP), Cleveland Cliffs Inc. (CLF), Temple Inland, Inc. (TIN) and Steel Dynamics Inc. (STLD) are also solid.

Within the Telecomm / Broadband grouping look at Fidelity Select Comm. Eqp. (FSDCX), ProFund Ultra Sector Telecom (TCPIX), Rydex Telecommunications (RYMIX), Belden CDT Inc. (BDC), MEMC Electrical Material (WFR), Avnet Inc. (AVT), Fei Co. (FEIC), Commscope Inc. (CTV), Qualcomm Inc. (QCOM), Anixter International Inc. (AXE), Harmonic Lightwaves, (HLIT) and Quanta SVCS, Inc. (PWR).

Short-Term Technical Indicators

Investor Sentiment

Long-Term Market Model – Bearish since December 8th.

Asset Allocation – AAS Model Portfolios have 75% cash allocations and mixed long – short allocations.

Top Alpha Generating Securities
Date = Date of AAS “Buy” or “Short/Sell” Recommendation

Top Major Market ETF – No buy recommended major market investments

Top Style-Box ETF for Alpha – No buy recommended style-box investments

Top Sector ETF for Alpha – iShares Dow Jones U.S. Utilities (IDU 3/12/07)

Top Long Stocks for Alpha

Precision Castparts Corp. (PCP 9/20/06)

Allegheny Technology Inc. (ATI 10/5/06)

Deckers Outdoor Corp. (DECK 9/7/06)

Blue Coat Systems Inc. (BCSI 3/1/07)

WebEx Communications Inc. (WEBX 2/13/07)

Belden CDT Inc. (BDC 1/19/07)

Chemed Corp. (CHE 3/8/07)

Constellation Energy Group Inc. (CEG 11/24/06)

Ryerson Inc. (RYI 12/7/06)

Rock-Tenn Co. (RKT 4/27/06)

Top Short Stocks for Alpha

Beazer Homes USA Inc. (BZH 1/25/07)

Meritage Homes Corp. (MTH 12/18/06)

Spectrum Brands Inc. (SPC 2/8/07)

Shuffle Master Inc. (SHFL 12/11/06)

The Ryland Group Inc. (RYL 2/20/07)

Labels:

AAS Top Six on March 8, 2007

The graphs below represent our top rated investments within six different categories as of Friday, March 9, 2007. The analytics we use to rate and select investments are based on a time-weighted alpha rating score that seeks to highlight investments beginning a bullish trend and generating alpha. Three of the six investments have positive returns with an average gain of 14.67% since the initial “buy” or “short/sell” recommendation. This performance is to be expected given the volatility and broad-market weakness experienced of late.

I’ve color-coded the graphs to represent one of the three “recommendations” our analytic produces for each security. A red line coincides with a “Short/Sell” recommendation. A blue line represents a “Neutral” or “Hold” recommendation and the green line equates to a “Buy” recommendation.

The green arrow represents the first date that the security became an “AAS Recommended Buy” after previously being an “AAS Recommended Sell.” For the “Short/Sell” group, the red arrow represents the first date that the security became an “AAS Recommended Sell” after previously being “buy” recommended. Also included are the most recent recommendations of each security.

(Click on Chart/Graphs to enlarge)

Thursday, March 15, 2007

Good Morning

Short-Term Technical Indicators

Investor Sentiment

Long-Term Market Model – Bearish since December 8th.

Asset Allocation – AAS Model Portfolios have 75% cash allocations and mixed long – short allocations.

Beta Exposure and Portable Alpha Generation
Date = Date of AAS “Buy” or “Short/Sell” Recommendation

Top Rated Major Market Derivative – No buy recommended major market investments

Top Rated Style-Box Derivative – No buy recommended style-box investments

Top Rated Sector Derivative – iShares Dow Jones U.S. Utilities (IDU 3/12/07)

Today’s Top “Buy” Recommended Stocks

Precision Castparts Corp. (PCP 9/20/06)

RTI International Metals (RTI 10/11/06)

Allegheny Technology Inc. (ATI 10/5/06)

Vulcan Materials Co. (VMC 10/31/06)

Deckers Outdoor Corp. (DECK 9/7/06)

Blue Coat Systems Inc. (BCSI 3/1/07)

WebEx Communications Inc. (WEBX 2/13/07)

Chemed Corp. (CHE 3/8/07)

Ryerson Inc. (RYI 12/7/06)

Constellation Energy Group Inc. (CEG 11/24/06)

Today’s Top “Sell” Recommended Stocks

Beazer Homes USA Inc. (BZH 1/25/07)

Meritage Homes Corp. (MTH 12/18/06)

Fremont General Corp. (FMT 12/29/06)

Shuffle Master Inc. (SHFL 12/11/06)

Daktronics Inc. (DAKT 2/14/07)

Wednesday, March 14, 2007

Good Morning

High volatility continues to define the trading environment, with the Dow dropping below 12,000 intraday only to end the session well above that psychologically significant level. Wednesday’s market volatility was driven by somewhat positive news on the U.S Current Account deficit, which reportedly narrowed for the last quarter. The improvement came in part due to lower costs for imported oil and the slowing of price increases associated with other imported goods. Reports released by both the Department of Labor and the Department of Commerce reflected the improvement in the Current Account Deficit.

The Dow Jones Industrial Average was up 57.44 points, or 0.48 percent, to end at 12,133.40. The S&P 500 Index finished up 9.22 points, or 0.67 percent, at 1,387.17 and the NASDAQ Composite Index ended up 21.17 points, or 0.90 percent, at 2,371.74. All three indices erased significant mid-session tumbles as investor’s regained confidence believing that mortgage delinquencies pose less of a risk to the financial system than previously thought. Elsewhere it was reported that all sixteen homebuilders in the S&P 500 advanced.

Trading was moderate to heavy, with about 2.08 billion shares changing hands on the NYSE with advancing stocks outnumbering declining ones by a ratio of about 20 to 13. On the tech-heavy NASDAQ, about 2.29 billion shares were traded with about sixteen advancers for every 13 decliners.

The Bearish posture of our Major Market Model has deepened as the result of this weeks weak market performance and we maintain our Bearish advisory which as been in place since December 8th, 2006. We’ve made the decision to reduce both our long and short exposure further from 50% to 25%, thus increasing our cash levels to 75% in all five model portfolios. We feel that maintaining a significant allocation in money market investment is the best strategy over the short-term.

You will note that we have removed New Century Financial Corp. (NEW) from Today’s Top “Sell” Recommended Stocks list after a long run. The removal came after the NYSE suspended trading in the shares of NEW on Tuesday due to the worsening financial condition of the company along with a pull back by lenders and rumors of defaulted debt obligations.

Short-Term Technical Indicators

Investor Sentiment

Long-Term Market Model – Bearish since December 8th.

Asset Allocation – AAS Model Portfolios have 75% cash allocations and mixed long – short allocations.

Beta Exposure and Portable Alpha Generation
Date = Date of AAS “Buy” or “Short/Sell” Recommendation

Top Rated Major Market Derivative – No buy recommended major market investments

Top Rated Style-Box Derivative – No buy recommended style-box investments

Top Rated Sector Derivative – Broadband HOLDRs (BDH 3/14/07)

Today’s Top “Buy” Recommended Stocks

Chicago Mercantile Exchange (CME 3/6/07)

RTI International Metals (RTI 10/11/06)

Precision Castparts Corp. (PCP 9/20/06)

Blue Coat Systems Inc. (BCSI 3/1/07)

Deckers Outdoor Corp. (DECK 9/7/06)

Belden CDT, Inc. (BDC 1/19/07)

Ryerson Inc. (RYI 12/7/06)

Chemed Corp. (CHE 3/8/07)

Deere & Co. (DE 1/11/07)

Big Lots Inc. (BIG 5/25/06)

Today’s Top “Sell” Recommended Stocks

Meritage Homes Corp. (MTH 12/18/06)

Beazer Homes USA Inc. (BZH 1/25/07)

Fremont General Corp. (FMT 12/29/06)

Daktronics Inc. (DAKT 2/14/07)

Shuffle Master Inc. (SHFL 12/11/06)

Labels:

Sunday, March 11, 2007

Good Morning

Our long-term market model remains bearish as of December 8th. The total universe of stocks, ETF’s and mutual funds which we review on a daily basis is 1862. Of those reviewed, 258 are rated "Buy," 767 are rated "Sell" and 837 "Neutral." Our model portfolios are currently allocated with 50% in cash or money market investments and the other 50% mixed between long and inverse funds. The model stock portfolio remains roughly 50% long with 50% cash.

Although our analytic has yet to upgrade any Major Market, Style-Box or Sector investments, we continue to see alpha generation in the following sectors: Transport, Utilities, Basic Materials, Telecom, and Natural Resource. In terms of style-box categories, the Mid Cap groups are showing the most strength.

Some Exchange Traded funds worth further examination include PowerShares Dynamic Semiconductors (PIS) and Semiconductor HOLDRs (SMH) along with iShares Dow Jones Basic Materials (IYM), Vanguard Materials (VAW)and Materials SPIDR (XLB). Attractive plays in the Utilities sector would include Utilities HOLDRs (UTH), iShares Dow Jones U.S. Utilities (IDU) and Vanguard Utilities (VPU).

In line with the above mentioned sectors, funds generating alpha from Fidelity include Fidelity Select Utilities Growth (FSUTX), Fidelity Select Telecommunications (FSTCX), Fidelity Select Natural Resources (FNARX) and Fidelity Select Electronics (FSELX).

Sector plays from ProFunds would include both the Ultra Sector Wireless (WCPIX) and the Rising U.S. Dollar fund (RDPIX). Those seeking to work into the bearishness of the market would find the Ultra Short OTC (USPIX), Ultra Short Dow (UWPIX) and Ultra Bear (URPIX) funds to their likening. Similar selections from within the Rydex family include Inverse Dynamic OTC (RYVNX), Inverse Dynamic Dow (RYCWX), Inverse S&P 500 (RYTPX)and Inverse OTC (RYAIX).

What started as a promising early morning rally fizzled out after lunch on Friday, as investors and traders alike closed their positions over the weekend. Moving the market was data indicating the continuation of moderate economic growth. Among the data points released was a decrease in the U.S. trade deficit in January to $59.1 billion, the addition of 97,000 jobs to non-farm payrolls in February and the easing in the unemployment rate from 4.6 to 4.5 percent. But concerns over the sub-prime mortgage market curbed the optimism from the healthy economic reports.

The Dow Jones Industrial Average rose 15.62 points, or 0.13 percent, to 12,276.32. The S&P 500 index edged up 0.96 point, or 0.07 percent, to 1,402.85 and the NASDAQ Composite index slipped 0.18 point, or 0.01 percent, to 2,387.55. All three U.S. stock indexes rose over the past week.

U.S. Treasury bond and gold prices fell after the jobs data while the dollar rallied. Benchmark 10-year notes traded down 18/32 in price for a yield of 4.60 percent. Spot gold rose as high as $658.00 an ounce before falling to $649.90/650.65 and gold for April delivery on the COMEX settled down $3.50 at $652.00 an ounce. The Dollar erased more than half of the losses incurred from the carry trade sell-off, with the greenback up 1.3% this week to 118.37 Yen. The Euro traded lower by 0.1% to $1.3111. Finally, April crude settled $1.59 lower, or 2.6 percent, at $60.05 a barrel.

The FTSE 100 ended up 17.5 points, or 0.28 percent, at 6,245.2 while the FTSEurofirst 300 Index closed up 0.2 percent at 1,489.5 points. The CAC 40 gained 0.3 percent while the DAX ended up 0.1 percent. In Tokyo, the Nikkei 225 Index gained 0.43 percent to close at 17,164.04.

The week ahead is chock full of economic data that will give investors further insight into the health of the economy and direction of interest rates. Tuesday will see the release of February retail sales and Thursday will see the Producer Price Index. But most of the data comes at the end of the week including the Consumer Price Index, March Consumer Sentiment, and the Federal Reserve’s February report on industrial production and capacity utilization. Finally, Friday marks the quarterly expiration and settlement of four different types of March futures and options contracts -- a convergence known as quadruple witching.

Short-Term Technical Indicators

Investor Sentiment

Long-Term Market Model – Bearish since December 8th.

Asset Allocation – AAS Model Portfolios have 50% cash allocations and mixed long – short allocations.

Beta Exposure and Portable Alpha Generation
Date = Date of AAS “Buy” or “Short/Sell” Recommendation

Top Rated Major Market Derivative – No buy recommended major market investments

Top Rated Style-Box Derivative – No buy recommended style-box investments

Top Rated Sector Derivative – No buy recommended sector investments.

Today’s Top “Buy” Recommended Stocks

Chicago Mercantile Exchange (CME 3/6/07)

Martin Marietta Materials, Inc (MLM 11/6/06)

Vulcan Materials Co. (VMC 10/31/06)

Brush Engineered Material (BW 3/6/07)

Precision Castparts Corp. (PCP 9/20/06)

Allegheny Technologies Inc. (ATI 10/5/06)

Chemed Corp. (CHE 3/8/07)

Blue Coat Systems Inc. (BCSI 3/1/07)

Deckers Outdoor Corp. (DECK 9/7/06)

Belden CDT Inc. (BDC 1/19/07)

Today’s Top “Sell” Recommended Stocks

New Century Financial Corp. (NEW 6/13/06)

Meritage Homes Corp. (MTH 12/18/06)

Fremont General Corp. (FMT 12/29/06)

Plexus Corp. (PLXS 1/5/07)

Beazer Homes USA Inc. (BZH 1/25/07)

Labels: