Portable Alpha Daily

Google
 
Web alpha-advisor.com

Monday, April 30, 2007

Good Morning

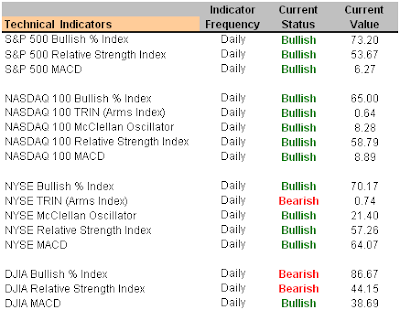
Short-Term Technical Indicators

Investor Sentiment


Long-Term Market Model – Bullish since April 27, 2007

Asset Allocation Recommendation – AAS Model Portfolios are allocated at 75% cash and 25% long.

Top Alpha Generating Securities
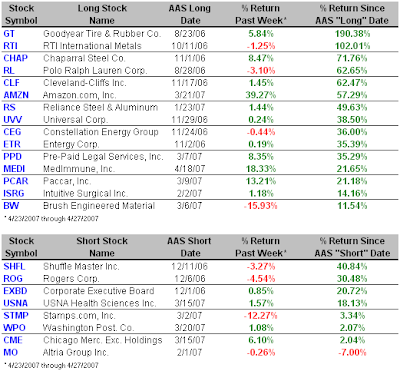
Date = Date of AAS “Buy” or “Short/Sell” Recommendation

Top AAS Rated Major Market ETF – NASDAQ 100 Trust Shares (QQQQ 4/27/07)

Top AAS Rated Style-Box ETF for Alpha – iShares Morningstar Mid Cap Growth (JKH 3/20/07)

Top AAS Rated Sector ETF for Alpha – iShares Dow Jones U.S. Utilities (IDU 3/12/07)

Top AAS Rated Long Stocks for Alpha

Varian Semiconductor (VSEA 3/27/07)

Amazon.com, Inc. (AMZN 3/21/07)

Chaparral Steel Co. (CHAP 11/1/06)

MedImmune, Inc. (MEDI 4/18/07)

The Goodyear Tire & Rubber Co. (GT 8/23/06)

Deckers Outdoor Corp. (DECK 9/7/06)

Reliance Steel & Aluminum (RS 1/23/07)

Cleveland-Cliffs Inc. (CLF 11/17/06)

Sotheby’s (BID 2/1/07)

Express Scripts, Inc. (ESRX 2/5/07)

Top AAS Rated Short Stocks for Alpha

Chicago Mercantile Exchange Holdings (CME 3/15/07)

The Corporate Executive Board Co. (EXBD 12/1/06)

Google Inc. (GOOG 12/18/06)

USNA Health Sciences Inc. (USNA 3/15/07)

The Washington Post & Co. (WPO 3/8/07)

Sunday, April 29, 2007

Alpha and the Week Ahead

The AAS Market Model turned Bullish as of the close Friday, April 27, 2007. The Technical component of our model is the one which turned bullish and consequently shifted the overall model to bullish status. The total universe of stocks, ETF’s and mutual funds which we review on a daily basis is 1835. Of those reviewed, 331 are rated "Buy," 475 are rated "Sell" and 1029 "Neutral.” Because we view this market as overbought and unsustainable, we have chosen not to increase our model portfolio allocations to 100% long. Instead, we will maintain our current allocations of 75% long and 25% cash.

Despite the recent rally and recovery, it’s difficult not to be concerned that the market is even more primed for a sell-off than it was in late February. When you look at the dynamics of the markets over the last few weeks you’ll see a significant increase in oil prices, the continued decline in the dollar, corporate earnings growth tapering off, the economy slowing and now the entry into the summer trading session. Although the bulls are clearly running the show, the bears are lurking around the corner, and this is cause for concern, especially since the full effects of the housing correction may not have been realized yet.

Even though the market has experienced a nice recovery and upside acceleration, some of the data we monitor are showing an increase in fear, not optimism. We see momentum indicators such as the relative-strength index, stochastic, and TRIN as having moved into overbought territory, which is obviously a negative. Friday’s breadth numbers on both the NYSE and the NASDAQ were again weak. Our reading of Investors Sentiment remains Neutral. In additional, we are just weeks away from the beginning of the summer season, which traditionally is subject to accelerated volatility with the majority of professional investors either on the sidelines or working reduced weeks for the summer season. In previous years this scenario typically produced a recipe for caution.

Short-Term Technical Indicators

Investor Sentiment

Long-Term Market Model – Bullish since April 27, 2007

Asset Allocation – AAS Model Portfolios are allocated at 75% cash and 25% long.

Top Alpha Generating Securities
Date = Date of AAS “Buy” or “Short/Sell” Recommendation

Top Major Market ETF – NASDAQ 100 Trust Shares (QQQQ 4/27/07)

Top Style-Box ETF for Alpha – iShares Morningstar Mid Cap Growth (JKH 3/20/07)

Top Sector ETF for Alpha – iShares Dow Jones U.S. Utilities (IDU 3/12/07)

Top Long Stocks for Alpha

Varian Semiconductor (VSEA 3/27/07)

Amazon.com, Inc. (AMZN 3/21/07)

MedImmune, Inc. (MEDI 4/18/07)

Chaparral Steel Co. (CHAP 11/1/06)

The Goodyear Tire & Rubber Co. (GT 8/23/06)

Deckers Outdoor Corp. (DECK 9/7/06)

PACCAR Inc. (PCAR 3/9/07)

Reliance Steel & Aluminum (RS 1/23/07)

Sotheby’s (BID 2/1/07)

Cleveland-Cliffs Inc. (CLF 11/17/06)

Top Short Stocks for Alpha

Chicago Mercantile Exchange Holdings (CME 3/15/07)

The Corporate Executive Board Co. (EXBD 12/1/06)

The Washington Post & Co. (WPO 3/8/07)

USNA Health Sciences Inc. (USNA 3/15/07)

Shuffle Master Inc. (SHFL 12/11/06)

Review of Last Week’s Top Stocks for Alpha

Wednesday, April 25, 2007

Mid-Week Alpha

The AAS Model Portfolio handouts have been updated through the end of March. They can be viewed by clicking on the links in the performance table to the right.

Short-Term Technical Indicators

Investor Sentiment

Long-Term Market Model – Bearish since December 8th.

Asset Allocation – AAS Model Portfolios are allocated at 75% cash and 25% long.

Top Alpha Generating Securities
Date = Date of AAS “Buy” or “Short/Sell” Recommendation

Top Major Market ETF – Diamonds Trust, Series 1 (DIA)

Top Style-Box ETF for Alpha – iShares Morningstar Mid Cap Growth (JKH 3/20/07)

Top Sector ETF for Alpha – iShares Dow Jones U.S. Utilities (IDU 3/12/07)

Top Long Stocks for Alpha

Brush Engineered Material (BW 3/6/07)

Chaparral Steel Co. (CHAP 11/1/06)

MedImmune, Inc. (MEDI 4/18/07)

Reliance Steel & Aluminum (RS 1/23/07)

Amazon.com, Inc. (AMZN 3/21/07)

Pre-Paid Legal Service, Inc. (PPD 3/7/07)

Entergy Corp. (ETR 11/2/06)

Constellation Energy Group (CEG 11/24/06)

PACCAR Inc. (PCAR 3/9/07)

Cleveland-Cliffs Inc. (CLF 11/17/06)

Top Short Stocks for Alpha

Chicago Mercantile Exchange Holdings (CME 3/15/07)

The Corporate Executive Board Co. (EXBD 12/1/06)

The Washington Post Co. (WPO 3/8/07)

USNA Health Sciences Inc. (USNA 3/15/07)

Shuffle Master, Inc. (SHFL 12/11/06)

Sunday, April 22, 2007

Alpha and the Week Ahead

Next week, Wall Street's attention will again be driven by earnings. Strong first-quarter earnings reports helped drive this week's gains and may provide a similar boost next week, in large part because consensus expectations for the quarter may have been too low. Bloomberg reported that about 66 percent of companies in the S&P 500 have reported first-quarter results topping analysts' estimates as compared to about 61 percent of S&P 500 members beating estimates in the fourth quarter of 2006.

But stocks don't move in one direction forever. Once the earnings season ends the weakening economic data pointing to a potentially slowing economy will undoubtedly take precedent with investors.

We continue to remain modestly Bearish, in line with the posture of our long-term market model adopted on December 8, 2006. However, we have adjusted our model portfolio recommendations and are currently recommending an allocation in the range of 25% in cash or money market investments and 75% Long Funds or ETF’s. The Model Stock portfolio was increased to 73% equities and 27% cash this past week.

In my March 11, 2007 post, I pointed you toward alpha generating opportunities in Mid Caps, Utilities and Natural Resource categories among a few others. There still exist, in my opinion, attractive opportunities within these areas especially with regard to the iShares Morningstar Mid Growth (JKH), iShares Morningstar Mid Value (JKI) or the iShares Morningstar Mid Core (JKG).

Within the Oil and Gas universe these ten selections lead the pack of companies with attractive AAS Rating Scores and current Buy recommendations:

Tidewater Inc (TDW)

Schlumberger Ltd. (SLB)

Valero Energy Corp (VLO)

Chevron Texaco Corp (CVX)

Baker Hughes Inc (BHI)

Suncor Energy Inc (SU)

Exxon Mobil Corp (XOM)

Helmerich & Payne Inc. (HP)

Devon Energy Corp (DVN)

Encana Corporation (ECA)

Our review of the Utilities grouping produced the following ten companies which currently are leading based upon AAS Rating Scores and current Buy recommendations:

Entergy Corp (ETR)

Public Svc Enterprise Group (PEG)

Equitable Resources Inc (EQT)

American Electric Power Inc (AEP)

Excelon Corp (EXC)

Questar Corp (STR)

FirstEnergy Corp (FE)

MDU Resources Group Inc (MDU)

Southwestern Energy Co (SWN)

Interstate Energy Corp (LNT).

Mutual Funds aligned with this strategy would include:

ProFund Ultra Sector Oil & Gas (ENPIX)

ProFund Ultra Sector Utilities (UTPIX)

Rydex Energy Services (RYVIX)

Fidelity Select Energy Service (FSESX)

Rydex Utilities (RYUIX)

Fidelity Select Utilities Growth (FSUTX)

Fidelity Select Energy (FSENX)

Fidelity Select Natural Resources (FNARX)

Rydex Energy (RYEIX)

Short-Term Technical Indicators

Investor Sentiment

Long-Term Market Model – Bearish since December 8th.

Asset Allocation – AAS Model Portfolios are allocated at 75% cash and 25% long.

Top Alpha Generating Securities
Date = Date of AAS “Buy” or “Short/Sell” Recommendation

Top Major Market ETF – iShares NYSE Composite (NYC)

Top Style-Box ETF for Alpha – iShares Morningstar Mid Cap Growth (JKH 3/20/07)

Top Sector ETF for Alpha – iShares Dow Jones U.S. Utilities (IDU 3/12/07)

Top Long Stocks for Alpha

Brush Engineered Material (BW 3/6/07)

RTI International Metals (RTI 10/11/06)

Chaparral Steel Co. (CHAP 11/1/06)

Polo Ralph Lauren Corp. (RL 8/28/06)

The Goodyear Tire & Rubber Co. (GT 8/23/06)

Cleveland-Cliffs Inc. (CLF 11/17/06)

Entergy Corp. (ETR 11/2/06)

Intuitive Surgical Inc. (ISRG 2/2/07)

Constellation Energy Group (CEG 11/24/06)

Universal Corp. (UVV 11/29/06)

Top Short Stocks for Alpha

USNA Health Sciences Inc. (USNA 3/15/07)

Stamps.com Inc. (STMP 3/2/07)

Altria Group Inc. (MO 2/1/07)

The Corporate Executive Board Co. (EXBD 12/1/06)

Rogers Corp. (ROG 12/6/06)

Review of Last Week’s Top Stocks for Alpha

Wednesday, April 18, 2007

Mid-Week Alpha

Much noise was made this afternoon about the Dow Jones Industrial Average closing above 12,800 for the first time, riding a modest wave of financial sector bullishness. We strongly caution against excessive exuberance since only 11 of the 30 components finished higher for the session.

More importantly, the technicals for the session did not support the enthusiasm. More stocks declined than advanced on both the NYSE and the NASDAQ. On the NYSE, 1.28 issues declined for every one that advanced; on the NASDAQ 1.46 issues declined for every one that advanced. This less-than-stellar Advance / Decline relationship was further supported by declining volume outnumbering advancing volume on both exchanges.

According to Bloomberg, about 68 percent of the S&P 500 companies that have already reported first-quarter results have beaten analysts' estimates. However, we must caution that it is still early in the reporting season and those companies who have done well typically like to release the news quickly while those not doing so well will hold back as long as possible.

An early review of the ten major economic sectors reveals that only the Financial Sector turned in strong performance for today’s session. The Industrial component followed with what at best would be called an anemic day. The remaining eight sectors were down for the session - not a broad rally at all.

We continue to remain modestly Bearish, in line with the posture our long-term market model adopted on December 8, 2006. Although we’re cognizant of the “recovery” from late-February’s sell-off, we’re hesitant to fully adopt a “bullish” stature. Not only is our model raising concerns from a technical standpoint, but we’re again seeing increased levels of complacency in the market vis-à-vis Investor Sentiment surveys. In addition, we question what factors might propel the markets higher at this juncture in both the market cycle and the calendar year. Finally, even though our model portfolios are positioned defensively, we’ve still managed to capture roughly 50% of the recovery since February 27th.

The total universe of stocks, ETF’s and mutual funds which we review on a daily basis is 1842. Of those reviewed, 314 are rated "Buy," 354 are rated "Sell" and 1174 "Neutral.” We have adjusted our recommendations accordingly and are currently recommending an allocation in the range of 50% in cash or money market investments and 50% Long Funds or ETF’s.

The Model Stock portfolio was increased to 73% equities and 27% cash this past week. Some might question why the model fund portfolios are not allocated in line with the model stock portfolio. This is because a large percentage of the holdings in the four model portfolios are “neutral” rated. If our analytic rotates in some “buy” recommended funds, and if our market model strengthens to bullish status, we will likely increase the allocation.

Those seeking to add alpha following our weekend comments while enjoying diversification might look at the following mutual funds or ETF’s: ProFund Ultra Sector Precious Metals (PMPIX), Rydex Energy Services (RYVIX), PowerShares Dynamic Oil & Gas (PXJ), ProFund Ultra Sector Oil & Gas (ENPIX), Oil Service HOLDRS (OIH), Rydex Energy (RYEIX), iShares GS Natural Resource (IGE), iShares S&P Global Energy (IXC), Vanguard Energy (VDE), iShares DJ U.S. Energy (IYE), ProFund UltraSector Wireless (WCPIX), Rydex Dynamic Weakening Dollar (RYWBX), Fidelity Select Energy (FSENX), Fidelity Select Energy Service (FSESX), Fidelity Select Natural Resources (FNARX) and Currency Shares Euro Trust (FXE).

Long-Term Market Model – Bearish since December 8th.

Asset Allocation – AAS Model Portfolios are allocated at 50% cash and 50% long.

Top Alpha Generating Securities
Date = Date of AAS “Buy” or “Short/Sell” Recommendation

Top Major Market ETF – iShares NYSE Composite (NYC)

Top Style-Box ETF for Alpha – iShares Morningstar Mid Cap Growth (JKH 3/20/07)

Top Sector ETF for Alpha – iShares Dow Jones U.S. Utilities (IDU 3/12/07)

Top Long Stocks for Alpha

Brush Engineered Material (BW 3/6/07)

RTI International Metals (RTI 10/11/06)

U.S. Steel Co. (X 2/28/07)

Chaparral Steel Co. (CHAP 11/1/06)

Cleveland-Cliffs Inc. (CLF 11/17/06)

The Goodyear Tire & Rubber Co. (GT 8/23/06)

Entergy Corp. (ETR 11/2/06)

Universal Corp. (UVV 11/29/06)

Constellation Energy Group (CEG 11/24/06)

Chemed Corp. (CHE 3/8/07)

Top Short Stocks for Alpha

USNA Health Sciences Inc. (USNA 3/15/07)

Shuffle Master Inc. (SHFL 12/11/06)

The Corporate Executive Board Co. (EXBD 12/1/06)

Altria Group Inc. (MO 2/1/07)

Georgia Gulf Corp. (GGC 2/14/07)

Sunday, April 15, 2007

Alpha and the Week Ahead

The recent winning direction of the Dow Jones Industrial Average turned abruptly after starting the past week building on its longest daily win streak in four years. Triggering the turn about were comments by the Fed chairman on Wednesday, which once again raised doubts about future interest rate cuts and quickly put an end to the recent rally. With first-quarter earnings season now upon us, those companies reporting thus far are setting a tone for weaker than expected earnings, suggesting a difficult earnings front for 2007.

As previously reported, corporate profits had been running rampant. Based upon the performance of the past several years investors have come to expect double-digit increases in year-over-year operating earnings. However, since the end of 2006 the momentum has been slowing and many are not forecasting a return to the double digit level until latter this year.

Over recent weeks we have identified an alpha generating opportunity with the Rydex Dynamic Weakening Dollar (RYWBX) fund. Lately, others are beginning to comment on the fact that the decline in the dollar was afflicting Treasury prices as U.S. currency has fallen 2.5 percent against the Euro in the past month.

Investors will get more data on inflation and the economy this week as the Commerce Department will report the CPI and Core CPI results for March, along with data on Retail Sales, Business Inventories, Housing Starts and Building Permits, Crude Oil Inventories, Industrial Production, Capacity Utilization, Initial Jobless Claims and Leading Economic Indicators. The markets turned into negative territory last week after the Reuters/University of Michigan preliminary consumer-sentiment index for April came in at 85.3, lower than expected. Additionally, the International Energy Agency report that world oil output fell in March.

Expect more volatility as the preliminary consensus is that the coming weeks reports will, in all likelihood, reflect continuing weakness in the U.S. Economy.

We remain modestly Bearish, in line with the posture of our long-term market model adopted on December 8, 2006. The total universe of stocks, ETF’s and mutual funds which we review on a daily basis is 1842. Of those reviewed, 349 are rated "Buy," 452 are rated "Sell" and 1041 "Neutral.” In the AAS Model Fund portfolios, we are currently recommending an allocation in the range of 50% cash or money market investments and 50% Long Funds or ETF’s. The Model Stock portfolio is slightly more aggressive with an allocation of 73% equities and 27% cash.

While still slightly Bearish we see strong alpha performances amongst a handful of ETF’s which track both the Mid and Small Cap markets segments. The iShares Morningstar Small Growth (JKK), iShares S&P Small Cap 600 (IJR), iShares Morningstar Mid Growth (JKH), iShares S&P Mid Cap 400 (IJH), iShares Russell 2000 (IWM) all outperformed the S&P 500 over the past week.

Joining this select grouping we might also look at picks from the Energy, Oil and Gas, Natural Resource or Utilities sectors coming from within the Mid Cap market segments. A list of these members from the Mid Cap universe should include Southwestern Energy Co (SWN), Denbury Resources Inc (DNR), Ashland Coal Inc (ACI), Quicksilver Resources Inc (KWK), Forest Oil Corp (FST), Grant Prideco Inc. (GRP), Tidewater Inc (TDW), Helmerich & Payne Inc.(HP), Cooper Cameron Corp (CAM) or Newfield Exploration Co (NFX).

Short-Term Technical Indicators

Investor Sentiment

Long-Term Market Model – Bearish since December 8th.

Asset Allocation – AAS Model Portfolios are allocated at 50% cash and 50% long.

Top Alpha Generating Securities
Date = Date of AAS “Buy” or “Short/Sell” Recommendation

Top Major Market ETF – iShares NYSE Composite (NYC)

Top Style-Box ETF for Alpha – iShares Morningstar Mid Cap Growth (JKH 3/20/07)

Top Sector ETF for Alpha – iShares Goldman Sachs Natural Resources (IGE 3/19/07)

Top Long Stocks for Alpha

Brush Engineered Material (BW 3/6/07)

RTI International Metals (RTI 10/11/06)

U.S. Steel Co. (X 2/28/07)

Chaparral Steel Co. (CHAP 11/1/06)

Cleveland-Cliffs Inc. (CLF 11/17/06)

Chemed Corp. (CHE 3/8/07)

Belden CDT Inc. (BDC 1/19/07)

Universal Corp. (UVV 11/29/06)

Entergy Corp. (ETR 11/2/06)

Novell, Inc. (NOV 3/7/07)

Top Short Stocks for Alpha

USNA Health Sciences Inc. (USNA 3/15/07)

Beazer Homes USA Inc. (BZH 1/25/07)

Meritage Homes Corp. (MTH 12/18/06)

Altria Group Inc. (MO 2/1/07)

Daktronics Inc. (DAKT 2/14/07)

Thursday, April 12, 2007

More alpha in Energy than Utilities

Short-Term Technical Indicators

Investor Sentiment

Long-Term Market Model – Bearish since December 8th.

Asset Allocation – AAS Model Portfolios are allocated at 50% cash and 50% long.

Top Alpha Generating Securities
Date = Date of AAS “Buy” or “Short/Sell” Recommendation

Top Major Market ETF – iShares NYSE Composite (NYC)

Top Style-Box ETF for Alpha – iShares Morningstar Mid Cap Growth (JKH 3/20/07)

Top Sector ETF for Alpha – iShares Dow Jones U.S. Energy (IYE 3/19/07)

Top Long Stocks for Alpha

Brush Engineered Material (BW 3/6/07)

RTI International Metals (RTI 10/11/06)

U.S. Steel Co. (X 2/28/07)

Chaparral Steel Co. (CHAP 11/1/06)

Cleveland-Cliffs Inc. (CLF 11/17/06)

Precision Castparts Corp. (PCP 9/20/06)

Belden CDT Inc. (BDC 1/19/07)

Chemed Corp. (CHE 3/8/07)

Universal Corp. (UVV 11/29/06)

Novell, Inc. (NOV 3/7/07)

Top Short Stocks for Alpha

USNA Health Sciences Inc. (USNA 3/15/07)

Beazer Homes USA Inc. (BZH 1/25/07)

Daktronics Inc. (DAKT 2/14/07)
Meritage Homes Corp. (MTH 12/18/06)

Rogers Corp. (ROG 12/6/06)

Wednesday, April 11, 2007

Good Morning

Nothing looked good today after the release of the home-sales forecast and energy reports around mid-day. On the housing front, the National Association of Realtors released a report which reflected their projection that existing home sales will fall 2.2% this year to 6.34 million, compared with its previous forecast of a 0.9% decline. The decline was laid at the feet of the troubles with sub-prime mortgage lending. Energy prices rose on the news reflecting a decline in gasoline stocks to their lowest level since October 2005. Crude stockpiles, while continuing to rise, still came in well below the previously estimated levels.

The Dow Jones Industrial Average retreated 89.23, or 0.7 percent, to 12,484.62, its first drop since March 28. The S&P 500 Index slid 9.52, or 0.7 percent, to 1438.87, the NASDAQ Composite Index decreased 18.30, or 0.7 percent, to 2459.31 and the Russell 2000 index fell 6.27, or 0.77 percent, to 808.24.

On the NYSE, trading volume reached around 1.57 billion shares with 1,053 stocks gaining and 2,229 declining. Sixty-five companies closed at new highs while forty-three closed at new lows. At the NASDAQ, 1,056 stocks gained and 1,952 declined with a volume of 1,993 billion shares. Forty-three stocks hit new highs while fifty reached new lows.

Bonds fell upon the release of the Fed minutes. The 5 – Year Treasury note fell 2/32 to a yield of 4.64%, the benchmark 10-year Treasury note fell 4/32, yielding 4.739% and the 30-year bond was down 3/32 with a yield of 4.91%. The dollar, fueled by comments from Fed Chairman Bernanke that China is unlikely to sell off U.S. assets, traded at 119.31 yen, up from 119.10 yen late Tuesday, while the Euro settled at $1.342, down from $1.3433 on Wednesday. Gold prices remained unchanged.

Most major international markets closed modestly down, with the exception of Japan's Nikkei stock average, which closed up 0.03 percent. Britain's FTSE 100 edged down 0.07 percent, Germany's DAX index fell 0.19 percent, and France's CAC-40 lost 0.25 percent.

Also fueling the weakness was news that the Federal Reserve believes that the economy may slow without curbing inflation, raising the specter of higher interest rates The Fed's news added to concern which began today after the International Monetary Fund stated that the U.S. economy will expand at its slowest pace in five years. The Fed news indicated that higher borrowing costs may ``prove necessary'' and it gave no hint of a rate cut.

A quick review of the Market Heat report today shows all 10 economic sectors closed lower for the day. Only the Airlines Industrial Group showed a positive return for the day with declining groups being lead by the Telecom and Financials Services sectors.

We remain modestly Bearish, in line with the posture of our long-term market model it adopted on December 8, 2006. We have adjusted our recommendations accordingly and are currently recommending an allocation in the range of 50% in cash or money market investments and 50% Long Funds or ETF’s. The Model Stock portfolio was increased to 73% equities and 27% cash this past week.

Short-Term Technical Indicators

Investor Sentiment

Long-Term Market Model – Bearish since December 8th.

Asset Allocation – AAS Model Portfolios are allocated at 50% cash and 50% long.

Top Alpha Generating Securities
Date = Date of AAS “Buy” or “Short/Sell” Recommendation

Top Major Market ETF – iShares S&P Mid Cap 400 (IJH 3/20/07)

Top Style-Box ETF for Alpha – iShares Morningstar Mid Cap Growth (JKH 3/20/07)

Top Sector ETF for Alpha – iShares Dow Jones U.S. Utilities (IDU 3/12/07)

Top Long Stocks for Alpha

Brush Engineered Material (BW 3/6/07)

RTI International Metals (RTI 10/11/06)

U.S. Steel Co. (X 2/28/07)

Chaparral Steel Co. (CHAP 11/1/06)

Precision Castparts Corp. (PCP 9/20/06)

Cleveland-Cliffs Inc. (CLF 11/17/06)

Chemed Corp. (CHE 3/8/07)

Belden CDT Inc. (BDC 1/19/07)

Universal Corp. (UVV 11/29/06)

Constellation Energy Group (CEG 11/24/06)

Top Short Stocks for Alpha

Beazer Homes USA Inc. (BZH 1/25/07)

Meritage Homes Corp. (MTH 12/18/06)

Fremont General Corp. (FMT 12/29/06)

Shuffle Master Inc. (SHFL 2/9/07)

Daktronics Inc. (DAKT 2/14/07)

Tuesday, April 10, 2007

Good Morning

Short-Term Technical Indicators

Investor Sentiment

Long-Term Market Model – Bearish since December 8th.

Asset Allocation – AAS Model Portfolios are allocated at 50% cash and 50% long.

Top Alpha Generating Securities
Date = Date of AAS “Buy” or “Short/Sell” Recommendation

Top Major Market ETF – iShares S&P Mid Cap 400 (IJH 3/20/07)

Top Style-Box ETF for Alpha – iShares Morningstar Mid Cap Growth (JKH 3/20/07)

Top Sector ETF for Alpha – iShares Dow Jones U.S. Utilities (IDU 3/12/07)

Top Long Stocks for Alpha

Brush Engineered Material (BW 3/6/07)

RTI International Metals (RTI 10/11/06)

Precision Castparts Corp. (PCP 9/20/06)

U.S. Steel Co. (X 2/28/07)

Chaparral Steel Co. (CHAP 11/1/06)

Cleveland-Cliffs Inc. (CLF 11/17/06)

Vulcan Materials Co. (VMC 10/31/06)

Entergy Corp. (ETR 11/02/06)

Universal Corp. (UVV 11/29/06)

Constellation Energy Group (CEG 11/24/06)

Top Short Stocks for Alpha

Beazer Homes USA Inc. (BZH 1/25/07)

Fremont General Corp. (FMT 12/29/06)

Meritage Homes Corp. (MTH 12/18/06)

USNA Health Sciences Inc. (USNA 3/15/07)

Daktronics Inc. (DAKT 2/14/07)

Monday, April 09, 2007

Good Morning

Short-Term Technical Indicators

Investor Sentiment

Long-Term Market Model – Bearish since December 8th.

Asset Allocation – AAS Model Portfolios are allocated at 50% cash and 50% long.

Top Alpha Generating Securities
Date = Date of AAS “Buy” or “Short/Sell” Recommendation

Top Major Market ETF – iShares S&P Mid Cap 400 (IJH 3/20/07)

Top Style-Box ETF for Alpha – iShares Morningstar Mid Cap Growth (JKH 3/20/07)

Top Sector ETF for Alpha – iShares Dow Jones U.S. Utilities (IDU 3/12/07)

Top Long Stocks for Alpha

Brush Engineered Material (BW 3/6/07)

RTI International Metals (RTI 10/11/06)

U.S. Steel Co. (X 2/28/07)

Precision Castparts Corp. (PCP 9/20/06)

Cleveland-Cliffs Inc. (CLF 11/17/06)

Chaparral Steel Co. (CHAP 11/1/06)

Big Lots Inc. (BIG 5/25/06)

Varian Semiconductor (VSEA 3/27/07)

Entergy Corp. (ETR 11/02/06)

Universal Corp. (UVV 11/29/06)

Top Short Stocks for Alpha

Beazer Homes USA Inc. (BZH 1/25/07)

Fremont General Corp. (FMT 12/29/06)

Meritage Homes Corp. (MTH 12/18/06)

Daktronics Inc. (DAKT 2/14/07)

Altria Group Inc. (MO 2/1/07)