All eight of my short-term, technical indicators strengthened overnight. Seven are higher than last week’s levels, and eight are again higher than both last month’s and last year’s reading. I like what I’m seeing over the near term, with stocks again able to accomplish multi-day, consecutive gains. It wasn’t too long ago when such gains were newsworthy, and a continuation of this trend would serve as an excellent foundation for a late-year rally. I’m expecting the institutional investors to jump in next week, bring significant volume with them, and hopefully keep the markets moving in the right direction. That’s assuming that the Fed is indeed done increasing rates. In terms of volatility, we’re seeing significant reductions in the NASDAQ Volatility Index (VXN) as well as the Total and Index Put / Call ratios.
The long-term signal, bullish since August 23rd, continues to strengthen, further solidifying our conservative bullish sentiment. I’m going to wait until next week before a possible increase in equity allocation within the alpha-generating portion of an investment portfolio. Until then, I’d stick with an asset allocation strategy of between 50% and 75% equities.
I saw a huge jump this morning in the Major Markets currently holding a “buy” recommendation. Over the last few weeks the NYSE 100 (NYC), S&P 100 (OEF) and S&P 500 (IVV) have been the dominant markets that investors should look to for beta exposure. We added seven more markets this morning, for a total of ten, which the analytics indicate are generating alpha. The majority of these markets still have relatively weak rating scores, so I wouldn’t necessarily act on the data just yet. But it does paint an interesting picture regarding the immediate health of the market.
Large Cap Value (JKF) remains a solid style-box investment, but Small Cap Core (JKJ) and Small Cap Value (JKL) investments are also newly “buy” recommended investments. This development is exceptionally interesting, since at this point in the business cycle, small caps typically pass the torch to large caps.
There are ten different sectors currently “buy” recommended including: Semiconductors (IGW), Real Estate (IYR), Technology (IYW), Software (IGV), Networking (IGN), Healthcare (IYH), Utilities (IDU), Telecommunication (IYZ), Non-Cyclical (IYK) and Biotechnology (IBB).
Energy (IYE), Transports (IYT) and Natural Resources (IGE) all remain “sell” recommended sectors, although oil prices will likely go up today due to Iran’s refusal to comply with UN regulations. You might expect transports to improve based on lower oil prices, but in actuality, most of those companies rely on diesel or jet fuel, which are less responsive to changes in oil price.
My long-term model continues to strengthen and all eight short-term technical indicators improved over night. I’m getting the feeling that the markets are coiling, like a spring, ready to explode upwards on the right information. Perhaps its wishful thinking, perhaps not. We’ll just have to wait and see.
I still like the S&P 100 (OEF) and the NYSE 100 (NYC) as the major markets that investors should look to for beta. Interestingly enough, the S&P 500 (IVV) shifted to “neutral” status overnight, but just barely. I wouldn’t read too much into that however, at least not yet.
Large Cap Value (JKF) remains the sole style-box investment with a recommended “buy” status. Small Cap Core (JKJ) investments have done well over the last week, easily out-performing the other style-box derivatives. It’s still a “neutral” recommended investment, but I wouldn’t be surprised to see an upgrade to “buy” status if the current trend continues.
There are now nine “buy” rated and two “sell” rated sectors. Real Estate (IYR), Semiconductors (IGW), Utilities (IDU), Technology (IYW), Software (IGV), Healthcare (IYH), Telecommunication (IYZ), Non-Cyclical (IYK), and Networking (IGN) sectors are all favorable at the moment. Energy (IYE) and Natural Resources (IGE) continue to traverse the extremes, illustrating the recent volatility of those two sectors. I’ve said it several times, but energy investments should be within the long-term portion of your portfolio for now and not the actively-managed component. It’s just too hard to stay ahead of the game.
I’d like to point out the performance table I added in the right hand column. Included are rolling one-year and from-inception values for the five model portfolios we run and provide to our subscribers. These portfolios select the top alpha-generating investments from their respective categories and are designed for those investors, either private or professional, who want the benefits of portable alpha without having to actually select the investments. I apologize for breaking the unwritten “blog code” by promoting my business, but I wanted everyone to understand what those atypically good numbers represent. I’m obviously happy to discuss them, so send me an email if you have any questions.
The investment theory of “Portable Alpha” is predicated on the understanding that investors can combine, or “port,” returns achieved through active management with returns resulting from broad-based market exposure, thus out-performing the markets in general.
I obviously believe this is very possible, not only for institutional managers and hedge funds, but for private investors as well.
But rather than use sophisticated investments such as options and equity swap agreements along with leverage to provide cheap market exposure and “beta,” I think investors can use index correlated exchange traded funds that basically provide the same exposure and are much easier to trade.
Take the current markets for example. I think that investors wanting broad-based market exposure, which is the first component of a portable alpha strategy, should look to the NYSE 100 (NYC), S&P 100 (OEF) and S&P 500 (IVV). These are the only “buy” recommended major market index derivatives at the moment, based on our proprietary analytics, yet they provide investors with sufficient market exposure at a relatively low cost.
The Russell 1000 (IWB) and the Dow Jones U.S. Total Market (IYY) derivatives are strengthening, but we see these indexes as “neutral” investments, which means “hold” rather than “buy” or “sell.” We need these indexes to pass several independent technical indicators prior to being upgraded to “buy” status.
Additionally, we continue to observe weakness within the S&P 600 (IJR) and S&P 400 (IJH) indexes, although neither is “sell” recommended.
From there, investors should look to establish the “active management” portion, the second component of a portable alpha strategy.
Start first with style-box investments, such as Large Cap Value (JKF), which our analysis indicates is the strongest currently. Large Cap Growth (JKE) and Large Cap Core (JKD) investments are beginning to generate alpha, but I recommend patience until they strengthen further.
Next, narrow the active management strategy down further into specific sectors and/or industries. Real Estate (IYR), Software (IGV), Utilities (IDU), Technology (IYW), Healthcare (IYH), Semiconductors (IGW), Telecommunication (IYZ) and Non-Cyclicals (IYK) are the top alpha-generating sectors and are all recommended “buys” in this morning’s newsletter.
Finally, select specific stocks or funds from within those sectors or style-box’s that you’re comfortable actively managing.
For example, since Large Cap Value investments are doing well currently, I might look to Symbol Technologies (SBL), Equity Residential (EQR) or Advanced Micro Devices (AMD), all of which are Large-Cap Value companies that fall within one of the above sectors.
I realize that this strategy might seem foreign to some investors, especially those that have spent years utilizing a buy-and-hold approach. Some people just don’t want to actively manage their investments, which is perfectly fine if you’re willing to accept average returns.
But if you accept the theory, which more and more investors are doing, and are willing to do a little of the work yourself, then the next logical step is learning how to do it. To give you a better idea, check out our latest archived newsletter, especially the Market Overview and Portfolio Builder pages.
Actively managing an investment portfolio and generating portable alpha for yourself really is much easier, and cheaper, than you think.
With very little trading volume throughout the week, the markets ended mostly lower Friday, and down for the week, thanks in part to a slightly disappointing speech by Federal Reserve Chairman Ben Bernanke. Investors were hoping for dovish commentary regarding inflation and the weakening economy to balance out hawkish comments made by another Fed official earlier in the week. Unfortunately, Big Ben wasn’t in the mood to play market maker just yet.
A rally in oil and natural gas prices, which will likely lose traction today with news of a weakening Ernesto, facilitated a decline in blue chip stocks. The Dow Jones Industrial Average fell 20.41, or 0.18%, to 11,284.05. The S&P 500 index slipped 0.97, or 0.08%, to 1,295.09, while the NASDAQ composite rose 3.18, or 0.15%, to 2,140.29. Bond prices increased, with the 10-Year Treasury yield falling to 4.79%. The U.S. dollar was mixed against foreign currencies and gold prices rose.
The surplus of economic reports released this week will hopefully induce an increase in trading volume and activity, although that’s probably wishful thinking. Most of the heavy-hitters are enjoying their last week of vacation and as such we should expect more of the same this week.
Augusts’ consumer confidence index will be released on Tuesday with an expected drop from 106.5 to 103.5. This report, coupled with the release of the minutes from the most recent Federal Reserve meeting might be enough to initiate an intra-day rally.
Wednesday’s markets will be driven by the revised second-quarter real GDP, with investors expecting an annualized rate of 2.9% as opposed to the original 2.5% rate.
Thursday and Friday are the most important days with Personal Income, Employment and Manufacturing reports released. Investors are expecting a continuation of July’s reports which indicated slowing momentum and volatility in payroll growth.
Boooorrring. There really isn’t any other word to describe the last two weeks of August. Even if we see spectacular economic releases this week, there aren’t many in Wall Street to interpret them. That’ll have to wait until next week. Investors, in my opinion, should continue tweaking both their long-term and actively managed asset allocation strategies, setting themselves up for the rest of the year. Basically that means adjusting any overly-exposed sectors and trying to establish as neutral a bias as possible. That way, when the markets begin to gain traction, either positively or negatively, you’re in a position to either minimize losses or maximize gains. Flexibility is the name of the game for now, and any investor stuck in the mud is going to get buried.
I’m still conservatively bullish; in fact my macro model continues to strengthen, despite the relatively bland week and a weakening in my short-term indicators. The VIX is up over the last week, but the VXN is down. I’m expecting my indicators to remain mixed throughout the week which supports my asset allocation recommendation of between 50% and 75% equities for the alpha-generating portion of the overall investment portfolio.
In terms of alpha generation, the NYSE 100 (NYC), S&P 100 (OEF) and S&P 500 (IVV) are the best major market indexes at the moment. Large Cap Value (JKF) remains the strongest style-box investment while Energy (IYE), Real Estate (IYR), Natural Resources (IGE), Utilities (IDU), Software (IGV), Technology (IYW), Healthcare (IYH), Telecommunication (IYZ) and Non-Cyclicals (IYK) are the alpha-generating sectors.
Like I said earlier, I don’t think this week is necessarily ideal in terms of buying opportunities. The markets are too indecisive at the moment and buying into a prediction could spell disaster. But that’s not to say that this week is a waste, as it is an ideal time to develop a strategy for the rest of the year. Let’s say the markets rally, that the Fed turns dovish and that a soft-landing remains a possibility. Start isolating areas of your long-term portfolio that would benefit from a rally. You would probably want to reduce your treasury exposure and allocate into a broad-based index. You would also want to isolate a few sectors that are generating alpha. In terms of the actively managed portion of your portfolio, start putting together a watch-list of a dozen or so stocks and funds. Then, when the markets start moving, put them in play.
Conversely, if it looks like the markets are going to remain either range-bound or turn bearish, begin to reduce your market exposure and over-weight defensively, which basically means cash or bonds at the moment. The best thing that you can do now is have a plan and be ready to move once September rolls around.
Each weekend I post graphs of six holdings from the Top Ten page of our investment newsletter. The Top Ten page is broken down into six groups that include: Long Stocks, Short-Sell Stocks, Exchange Traded Funds, Fidelity Select Funds, ProFunds Funds and Rydex Funds. We include ten securities within each group, sixty in all, ranked first by the current “AAS Recommendation, “and then by the AAS Rating Score. Those that are “AAS Recommended Buys” and that have the highest AAS Rating Scores are at the top. The purpose of presenting performance in this manner is to illustrate how easy it is for investors to use our newsletter to actively manage a portion of their investment portfolio to generate alpha and outperform the market.
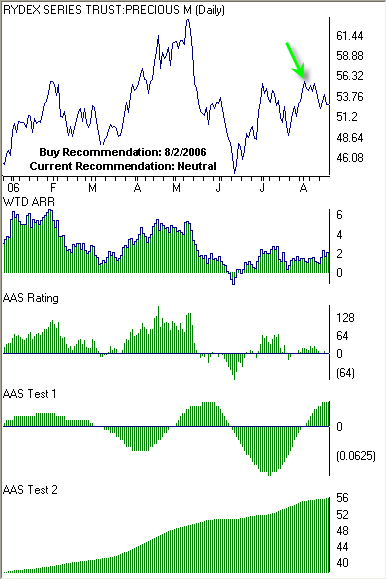
The graphs below represent the top holding within each of the six groups as of Friday, August 18, 2006. The green arrow represents the first date that the security became an “AAS Recommended Buy” after previously being an “AAS Recommended Sell.” I’ve also included the most recent recommendation of each security.
With such a bland week of trading on low volume and little economic stimulus, it’s no wonder that only four of the six AAS Top Ten securities are gainers. This week the three mutual funds took the spotlight, especially the Fidelity Select Software & Computer fund. I’m actually surprised by the relative weakness in the iShares S&P Latin American 40 Fund, losing over 1% since the initial “buy” recommendation. I suspect this is more due to profit taking than fundamental or technical weakness. And although I’m still favorable towards international markets, I’d keep a close watch on any international funds owned for further deterioration.
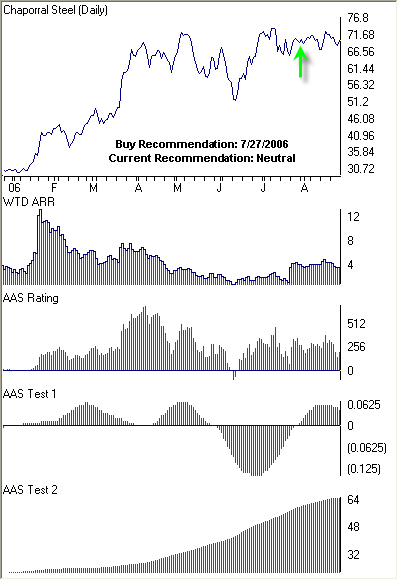
Chaparral Steel Company (CHAP) was our highest rated stock within the “Long Stock” group as of August 18, 2006. This marks the second time in three weeks where CHAP was the highest rated stock based on the AAS rating score. I noted in an earlier post that CHAP has been the victim of the elevated volatility the markets have dealt with over the last few weeks. The graph below further illustrates the trading-range that CHAP has been trapped in since mid-July. Our analysis produced a “buy” recommendation on July 27, 2006 when the closing price was 69.88. As of Friday, August 25th, CHAP closed at 69.72 for a loss of -0.22% since the initial “buy” recommendation. Currently, the stock carries a “neutral” recommendation meaning “hold.”
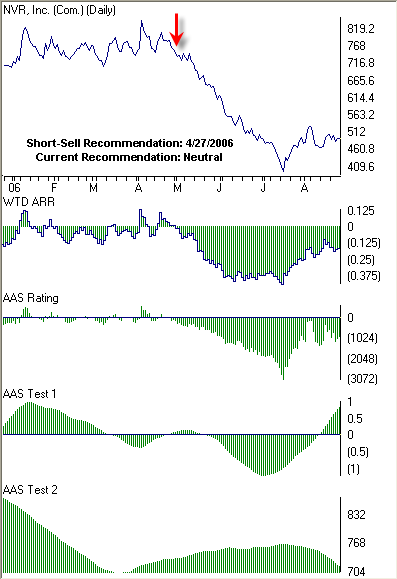
NVR, Inc. (NVR) was again our weakest stock within the “Short-Sell Stock” group. NVR was upgraded on April 25, 2006 to a “buy” recommended security, but then almost immediately reverted to a “sell” recommended security two days later when the closing price was 763.00. As of August 25th, NVR closed at 493.00 for a gain of 35.38% since the initial “short-sale” recommendation. Shorting stocks, although profitable if done correctly, is risky business. There's no need to do it unless you have the experience, knowledge, and capital to cover your short if needed. QMA does not short stocks for its clients and AAS does not recommend the practice to its subscribers.
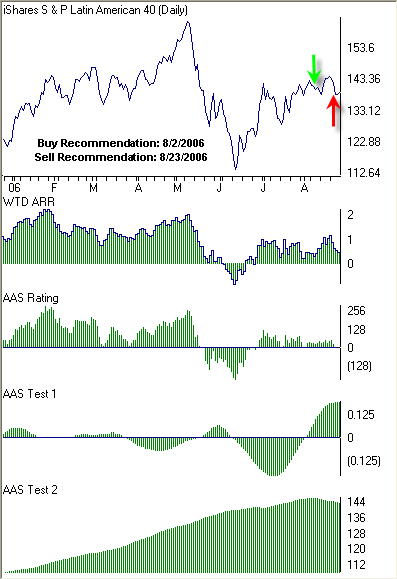
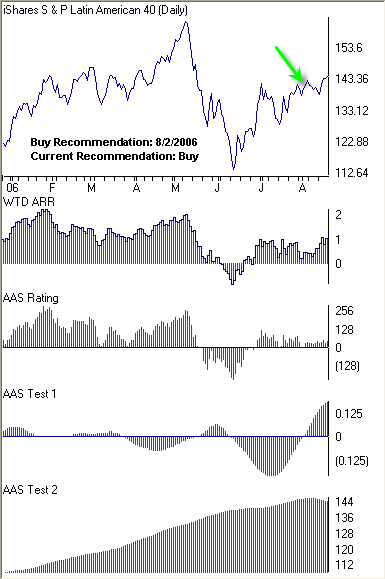
The iShares S&P Latin America 40 Index ETF (ILF) was our highest rated within the “Exchange Traded Fund” group. It was last up-graded to an "AAS Recommended Buy" on August 2, 2006 when the closing price was 140.09. We began to notice a strengthening in the international markets in late-July and I wrote about it in my August 10th post. Unfortunately, ILF has also experienced significant levels of volatility over the last few weeks, eventually culminating in a “sell” recommendation on August 23rd and had a closing price of 138.24 on August 25th. Despite the modest -1.32% loss since the initial “buy” recommendation, I still believe that international markets should be utilized, at least until the domestic markets solidify and establish either a bullish or bearish bias.
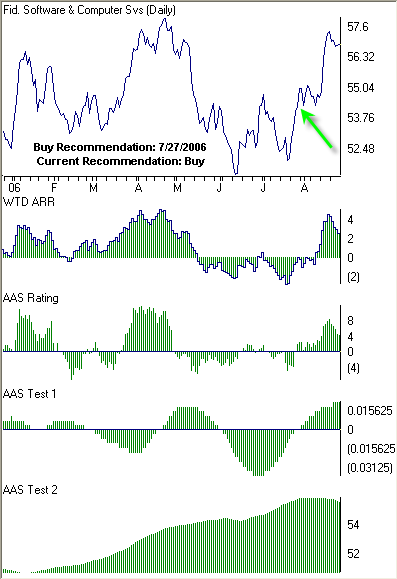
The Fidelity Select Software & Computer Fund (FSCSX) was our highest rated within the “Fidelity Select Mutual Fund” group. The fund normally invests 80% of assets in companies that design, produce or distribute software products. And although the software sector, as represented by IGV, lost over 1.80% last week, it’s up nearly 7.50% over the last month and remains an AAS Recommended “Buy” sector. FSCSX was last upgraded to an “AAS Recommended Buy” on July 27, 2006 when the closing price was 54.24. As of Friday, August 25th, FSCSX closed at 56.81 for a gain of 4.74% since the initial investment. Currently, FSCSX remains an “AAS Recommended Buy.”
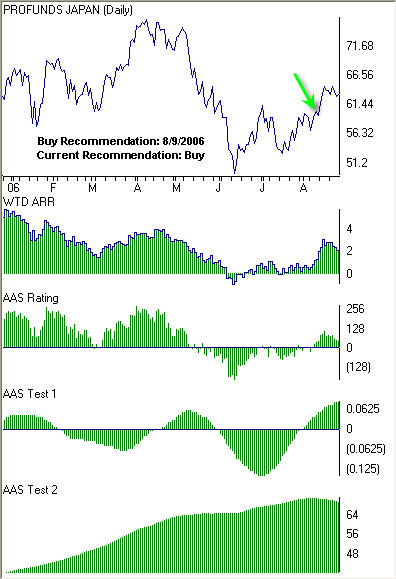
The ProFunds Ultra Japan Fund (UJPIX) was our highest rated within the “ProFund Mutual Fund” group for the second week in a row. Similar to our ETF analysis, we saw increased alpha-generation among international markets beginning several weeks ago, with Large-Cap Japan funds the highest among both ProFunds and Rydex. This fund, which is leveraged to correspond to 200% of the daily performance of the Nikkei 225 Stock Average, was last upgraded to an “AAS Recommended Buy” on August 9, 2006 when the closing price was 59.61. As of Friday, August 25th, UJPIX closed at 62.99 for a gain of 5.67%. Currently, UJPIX is an “AAS Recommended Buy.”
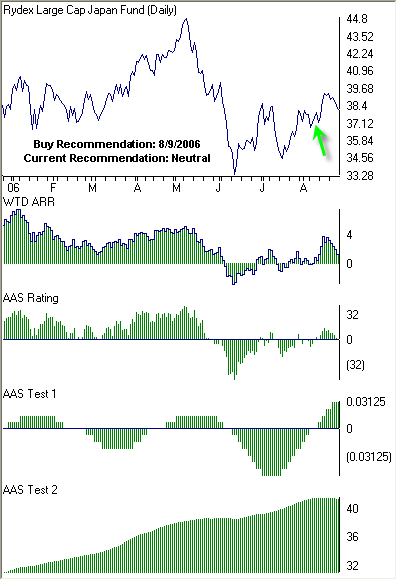
The Rydex Japan Advantage Fund (RYJPX) was our highest rated within the “Rydex Mutual Fund” group on August 18th. This mutual fund was last upgraded from an “AAS Recommended Neutral” to an “AAS Recommended Buy” on August 9, 2006 when the closing price was 37.51. As of Friday, August 25th, RYJPX closed at 38.13 for a gain of 1.65%. Unbeknownst to many mutual fund investors, RYJPX is designed to seek investment results that correlate to the daily price movement of the Topix 100 Index, as opposed to the Nikkei 225 like its counterpart at ProFunds. RYJPX uses sophisticated investments such as futures, options and equity swap agreements to apply leverage to the fund and increase exposure to 125% of the underlying index. Currently, RYJPX is an “AAS Recommended Neutral.”
Of the ten sectors currently producing the most alpha, Non-Cyclical (IYK) is, I believe, the only one that I haven’t highlighted yet in its own specific post. A non-cyclical investment, by definition, is not closely correlated to the movement of the markets as a whole, like cyclical investments are. Basically, no matter where the market is headed, people always need certain things such as beverages, soap and food. As such, non-cyclical stocks and funds are excellent sources of alpha and should most certainly be incorporated into both the long-term and actively managed components of your investment portfolio.
One of the difficulties with investing in non-cyclical companies is that the sector is so incredibly broad that investors have a difficult time narrowing down the potential candidates into a reasonable list. Just this morning, as I tried to put a list together of “buy” recommended non-cyclical securities, I had to review my master list three times to make sure I didn’t skip over any.
An easy method to create a workable list of non-cyclical investments is to think about what products you would still buy if you lost your job and then find companies that make those products.
For example, food and beverage companies are, for the most part, resilient to market declines. Currently, I like JM Smucker Co. (SJM) and Corn Products International Inc. (CPO).
If you’re a smoker, odds are you’re not going to quit smoking based on the Dow and S&P. Take a look at Reynolds American Inc. (RAI), UST Inc. (UST) or Altria Group Inc. (MO). I listed RAI in one of my previous posts as a Top Ten Stock in terms of alpha-generating potential.
Think about what other people need on a daily basis. Schools and offices use an incredible amount of paper, and will continue to do so. Companies such as Pope & Talbot Inc. (POP) or Rock-Tenn Co. (RKT) are currently generating alpha.
Perhaps you’d rather own more broad-based exposure to non-cyclicals, which is a great idea for the long-term component of your portfolio. The Vanguard Consumer Staples VIPERs (VDC) and the Consumer Staples Select Sector SPDR (XLP) are two Exchange Traded Funds that are recommended “buys” this morning.
In terms of mutual funds, the Fidelity Select Food and Agriculture (FDFAX), Fidelity Select Paper and Forest Products (FSPFX) funds as well as the Rydex Consumer Products (RYCIX) and the ProFunds Consumer Goods Ultra Sector (CNPIX) funds all provide excellent options.
Non-Cyclical investments are great at all times, and ones which I believe should always be included within an investment portfolio. With little certainty which way the markets will emerge once the heavy hitters return from vacation, now is a great time to adjust your portfolios to roll with the punches. Have a great weekend!
The U.S. stock markets traded lower on Wednesday amid concerns over existing home sales data and Iran’s failure to satisfy the U.N. Resolution. Existing home sales fell more than 4% in July to the lowest level since the beginning of 2004. The magnitude of the decline surprised investors and further agitated worries of a housing market crash and consequent recession. The inventory of homes for sale jumped 3.2%, the largest one-month rise ever. The Commerce Department reported this morning that new orders for durable goods declined by $5.3 billion in July and the Labor Department reported that the number of American’s filing unemployment benefit claims last week declined to 313,000.
The Dow Jones industrials closed down 42 points, or 0.4%, to 11,298. The Standard & Poor's 500 Index was down 5.8 points, or 0.5%, to 1,293, and the NASDAQ Composite Index was off 15.4 points, or 0.7%, to 2,135. Overseas, the Nikkei lost 1.3% but the European markets rebounded slightly despite light volume. The dollar weakened against the Euro due to a better than expected German business sentiment report.
Seven of my eight short-term technical indicators weakened overnight with the 9-Day Moving Average of the Dow Jones Industrial Average’s MACD the only indicator improving. Four of the eight indicators are higher than last week’s levels while seven are higher than last month’s reading. The S&P 500 On-Balance Volume % is the only indicator that is not beating levels from one year ago. The Market Volatility Index (VIX) and NASDAQ Volatility Index (VXN) continue to climb as does all three Put / Call ratios.
My long-term signal, bearish since April 25th, finally turned bullish overnight after several weeks of slow but steady improvement. Even though I’m now officially “bullish,” I am however an extremely cautious bull. The markets are as unpredictable as ever, so adopting an overly-aggressive strategy with current market conditions as they are might not be prudent. Despite the long-term macro model turning bullish, I continue to recommend an asset allocation strategy of between 50% and 75% equities for the alpha generating portfolio of the investment portfolio.
There remain only three Major Markets currently holding a “buy” recommendation: NYSE 100 (NYC), S&P 100 (OEF) and S&P 500 (IVV). Additionally, the S&P 600 (IJR) index reverted to a “sell” recommendation.
I still favor Large Cap Value (JKF) as the only “buy” recommended style-box investments, but I continue to see modest improvement within both the Large Cap Growth (JKE) and Large Cap Core (JKD) arenas.
There are nine different sectors currently “buy” recommended including: Real Estate (IYR), Utilities (IDU), Software (IGV), Financial Services (IYG), Telecommunication (IYZ), Financials (IYF), Technology (IYW), Healthcare (IYH) and Non-Cyclical (IYK). Energy (IYE), a sector I discussed yesterday, reverted to a “neutral” recommendation after further oil price declines. To be perfectly honest, I think it’s much easier to generate alpha in other sectors as opposed to energy at the moment. Most investors should have energy exposure within the long-term, buy-and-hold components of their investment portfolios and not as much within the actively managed portion, unless of course you have a market model that accurately predicts the thoughts of Iranian President Mahmoud Ahmadinejad.
Metal funds and stocks have generated significant alpha over the last few weeks and continue to provide opportunities for investors. There are twelve stocks or funds that are “buy” recommended in this morning’s newsletter related to the processing and/or fabrication of precious and non-precious metals. One of my favorites is Wolverine Tube Inc. (WLV), which our analytics upgraded to a “buy” on July 19, 2006, has done surprisingly well over the last one week and one month, gaining 25.58% and 37.15% respectively. Currently, the two highest rated metal companies are Aleris International Inc. (ARS) and Maverick Tube Corp. (MVK). I also like three metals funds including the Rydex Precious Metals Fund (RYPMX), the ProFunds Precious Metals Fund (PMPIX) and the Fidelity Select Gold Fund (FSAGX).
Not much changed overnight in terms of my short- and long-term market models. Over the last week, the Dow Jones Industrial Averages breadth, volume and stochastic analysis are signaling “neutrality.” The NYSE Advance / Decline line is weakening, as is the S&P 500 On-Balance Volume Percentage. The DJIA MACD and 9-Day MACD still point to a “positive” stance, but its relative strength is weakening. Needless to say I’m looking at a mixed bag of technical indicators to say the least as I’m sure most of you are too.
My long-term market model is now coming to the end of its four-month bearish journey. Since the model went negative on April 25th, the NASDAQ and Russell 2000 have declined by over 7% while the NYSE, S&P 500 and Dow Jones Industrial Average have fluctuated but remain relatively un-changed. It’s been a tough few months for investors not only in terms of range-bound markets, but also inflation and geo-political worries. I certainly hope the last four months of 2006 are a little easier to navigate.
In terms of alpha generating investments, I’m afraid not much has changed overnight either. I’m still seeing opportunity developing within the NYSE 100 (NYC), S&P 100 (OEF), S&P 500 (IVV) and the Dow Jones U.S. Total Market (IYY). The remaining ten major markets I analyze are all rated “neutral.” Large Cap Value (JKF) is the only “buy” recommended style-box investment of the nine analyzed. Again, the remaining eight are all rated “neutral.”
Ten sectors are currently “buy” recommended including: Energy (IYE), Natural Resources (IGE), Real Estate (IYR), Utilities (IDU), Software (IGV), Technology (IYW), Semiconductor (IGW), Telecommunication (IYZ), Healthcare (IYH) and Non-Cyclical (IYK). Seven sectors are “neutral” recommended while Transports (IYT) retains the “sell” recommendation that took place over a month ago.
There are over thirty Energy related stocks, funds and ETF’s which are recommended “buys” this morning. Two of the higher rated stocks are Marathon Oil Corp. (MRO) and Veritas DGC Inc. (VTS) which is an interesting company that focuses on “geophysical” information such as maps and other data that companies use to find oil and natural gas. VTS was last upgraded to a recommended “buy” in late-July. In terms of funds and ETF’s, investors still looking for an energy option should look at iShares S&P Global Energy (IXC), Fidelity Select Energy Portfolio (FSENX), ProFunds Oil & Gas (ENPIX) and Rydex Energy (RYEIX) funds.
Five of the eight short-term technical indicators improved overnight with the NYSE Advance / Decline Line and the Dow Jones Industrials Average’s 15-Day Stochastic and 15-Day Relative Strength Index weakening. All eight of the indicators are higher than both last week’s and last month’s levels while all but one, the S&P 500 On-Balance Volume % are higher than last year’s level. The Market Volatility Index (VIX) is nearly 17% lower than last week’s reading, but the NASDAQ Volatility Index (VXN) is slightly higher. My long-term signal, bearish since April 25th, has shown significant improvement over the last two weeks or so, but it still remains one or two days away from indicating a bullish reading. Basically I’m waiting for the difference between two exponential moving averages of the NASDAQ composite to shift from negative to positive territory. Even if I continue to see moderate declines due to profit-taking or geo-political influenced reluctance on Wall Street, I still think our model will continue its positive trend throughout the week meaning I’ll probably adopt an official bullish market view within the next few days. However, that doesn’t necessarily mean I’m going to recommend another increase in equity allocation just yet, as I feel that continued caution and measured exposure is the best strategy over the next few weeks.
Despite last week’s rally, there are only three Major Markets currently holding a “buy” recommendation: NYSE 100 (NYC), S&P 100 (OEF) and S&P 500 (IVV). However, there are no market indexes that are currently “sell” recommended, which is perhaps a more clairvoyant indication of the emerging strength in the broad-markets.
I still favor Large Cap Value (JKF) as the only “buy” recommended style-box investments, but I’m seeing improvement within both the Large Cap Growth (JKE) and Large Cap Core (JKD) arenas.
With ten different sectors currently “buy” recommended, generating alpha by actively managing within sectors remains the easiest and most efficient strategy. Energy (IYE) and Natural Resources (IGE) vaulted back to the top after an increase in oil and gas over the last week. With the current geo-political climate focused on oil, investors should maintain exposure to these sectors for awhile, but more within the long-term component of the investment portfolio, and not the actively managed portion.
Investors looking for alpha through active management of sector investments should continue to focus on Technology (IYW), Semiconductors (IGW), Software (IGV) as well as Real Estate (IYR) and Utilities (IDU).
Investors looking to generate alpha via Exchange Traded Funds should really be looking at international funds such as iShares S&P Latin America 40 Fund (ILF) which I highlighted in yesterday’s post. I analyze thirty-six international ETF’s and thirty-three of them are “buy” recommended this morning. ILF is the strongest rated fund, but at least eight others have rating scores higher than ten, which indicates significant trend development and strengthening technicals. Among the strongest are: MSCI EMU Index (EZU); iShares S&P Topix 50 (ITF) and Mexico Webs Index (EWW). In fact, two of those funds are currently held in our model ETF portfolio. An interesting area for generating alpha is Real Estate, which I analyze using the Dow Jones iShares Real Estate Fund (IYR). There’s a lot of discussion in the media about the weakness in homebuilders and the real estate bubble etc. etc. And I certainly agree with some of the analysis. That’s not to say however that investors should completely avoid real estate investments, which I feel is generating significant amounts of alpha at the moment. In fact, IYR was up over 2% last week and is up over 4% for the last month. I initially mentioned Real Estate in a mid-July post as a sector upgraded to a “buy” status and one that should be kept on the radar. I still think investors looking to invest in real estate should narrow their focus to REIT’s such as Public Storage Inc. (PSA), Essex Property Trust Inc. (ESS) or Shurgard Storage Centers Inc. (SHU) which are all highly rated this morning. Another solid real estate company is Kilroy Realty Corp. (KRC) which was upgraded to a “buy” in early-July and has done well since.
For investors looking for diversified exposure to Real Estate, funds such as the iShares Cohen and Steers Realty Majors (ICF), the Vanguard REIT Index VIPERs (VNQ) and the streetTRACKS Wilshire REIT (RWR) are solid solutions, as are the Rydex Real Estate (RYHRX) and the ProFunds Ultra Real Estate (REPIX) funds.
Each weekend I post graphs of six holdings from the Top Ten page of our investment newsletter. The Top Ten page is broken down into six groups that include: Long Stocks, Short-Sell Stocks, Exchange Traded Funds, Fidelity Select Funds, ProFunds Funds and Rydex Funds. We include ten securities within each group, sixty in all, ranked first by the current “AAS Recommendation, “and then by the AAS Rating Score. Those that are “AAS Recommended Buys” and that have the highest AAS Rating Scores are at the top. The purpose of presenting performance in this manner is to illustrate how easy it is for investors to use our newsletter to actively manage a portion of their investment portfolio to generate alpha for themselves.
The graphs below represent the top holding within each of the six groups as of Friday, August 11, 2006. The green arrow represents the first date that the security became an “AAS Recommended Buy” after previously being an “AAS Recommended Sell.” I’ve also included the most recent recommendation of each security. The performance this week improved over the previous week ending Friday, August 4, 2006 with five out of the six AAS Top Ten investments gaining.
Express Scripts Inc. (ESRX) was our highest rated stock within the “Long Stock” group as of August 11, 2006. ESRX was a “sell” recommended security in early June when it began to develop a positive trend. It took several weeks for the stock to pass all the criteria needed to be a recommended “buy,” which took place on July 14, 2006 at a price of 69.85. The closing price on Friday was 82.56, which results in a gain of 18.19% since the “buy” recommendation.
NVR, Inc. (NVR), which was highlighted several weeks ago as our weakest stock, was again the lowest rated within the “Short-Sell Stock” group as of August 11, 2006. NVR was upgraded on April 25, 2006 to a “buy” recommended security, but then almost immediately reverted to a “sell” recommended security two days later when the closing price was 763.00. As of Friday, NVR closed at 504.00 for a loss of 33.94% since the initial “short-sale” recommendation. Shorting stocks, although profitable if done correctly, is risky business. There's no need to do it unless you have the experience, knowledge, and capital to cover your short if needed. QMA does not short stocks for its clients and AAS does not recommend the practice to its subscribers.
The iShares S&P Latin America 40 Index ETF (ILF) was our highest rated within the “Exchange Traded Fund” group. It was last up-graded to an "AAS Recommended Buy" on August 2, 2006 when the closing price was 140.09. ILF has been a volatile issue over the last few weeks, but it remains a recommended “buy” ETF. As of Friday, ILF closed at a price of 144.08 for a gain of 2.84%.
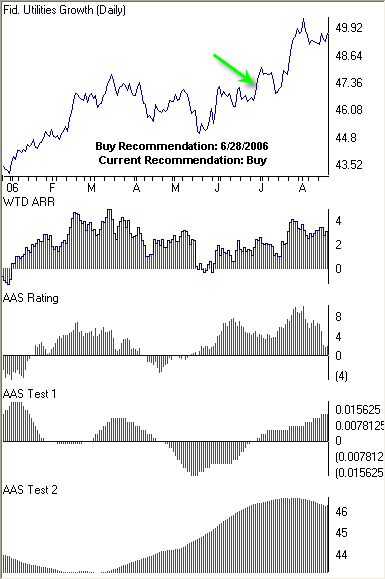
The Fidelity Select Utilities Growth Fund (FSUTX) was our highest rated within the “Fidelity Select Mutual Fund” group for the second week in a row. It was last upgraded from an “AAS Recommended Neutral” to an “AAS Recommended Buy” on June 28, 2006 when the closing price was 46.87. As of Friday, August 18th, FSUTX closed at 49.65 for a gain of 5.93% since the initial investment. Currently, FSUTX remains an “AAS Recommended Buy.”
The ProFunds Ultra Japan Fund (UJPIX) was our highest rated within the “ProFund Mutual Fund” group. This fund is leveraged to correspond to 200% of the daily performance of the Nikkei 225 Stock Average. This mutual fund was last upgraded to an “AAS Recommended Buy” on August 9, 2006 when the closing price was 59.61. As of Friday, August 18th, UJPIX closed at 63.77 for a gain of 6.98%. Currently, UJPIX is an “AAS Recommended Buy."
The Rydex Precious Metals Fund (RYPMX) was our highest rated within the “Rydex Mutual Fund” group for the second week in a row. This mutual fund was last upgraded from an “AAS Recommended Neutral” to an “AAS Recommended Buy” on August 2, 2006 when the closing price was 55.59. As of Friday, August 18th, RYPMX closed at 52.76 for a loss of 5.09%. Currently, RYPMX is an “AAS Recommended Neutral.”
Finding and applying alpha to a portfolio is no longer limited to wealthy hedge fund investors and institutions. In fact, any private or professional investor can develop, manage, and benefit from an investment portfolio based on our approach to alpha. And more importantly, investors can do so without losing value to high management fees. This blog will include selected data from the Alpha Advisor Service, LLC newsletter, a tool designed especially for those investors looking to find alpha.
Location: Charlotte, North Carolina, United States
I'm a quantitatively-focused professional with a passion for all financial markets and instruments. I incorporate technical analysis and trend following with top-down "black-box" security selection to generate alpha.
The material provided by Portable Alpha Daily is for general informational purposes only. This information is not intended as investment advice, as an offer or solicitation of an offer to sell or buy, or as an endorsement, recommendation or sponsorship of any company, security or fund. The contents of this website have been compiled from original and published sources believed to be reliable, but are not guaranteed as to accuracy or completeness. Pursuant to the provisions of Rule 206(4)-1 of the Investment Advisors Act of 1940, Portable Alpha Daily advises all visitors to recognize that they should not assume that recommendations made in the future will be profitable or will equal the performance of past recommendations. The visitor accepts the responsibility of his or her own investment research and decisions, and should seek the advice of a qualified securities professional before making any investment.